Page Details: KPI Performance Widget
The KPI Performance widget allows you to see the average score for quality assurance evaluations. You can then compare the actual performance against predetermined thresholds.
For more information, see inContact Workforce Optimization Widgets Overview.
Widget Settings
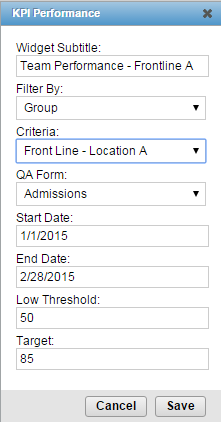
- Widget Subtitle
- Allows you to create a name for this instance of the widget. The title can be no more than 100 characters, including spaces and punctuation.
- Filter By
- Allows you to limit the display for this instance of the widget. The field offers the values Agent or Group from a drop-down list, with Agent as the default. The Group value refers to inContact Groups.
- Criteria
- Allows you to select a specific entity for this instance of the widget. The field offers values in a drop-down list based on your Filter By selection, and limited by your access permissions. For example, if you choose a Filter By value of Group, the Criteria list will display inContact Groups to which you have access.
- QA Form
- Allows you to filter the widget display by QA form. The field offers a drop-down list of forms in your system, presented in alphabetical order.
- Start Date
- Allows you to filter the widget display based on a date range. The field offers a date selector you can use to choose a starting date for the range.
- End Date
- Allows you to filter the widget display based on a date range. The field offers a date selector you can use to choose an ending date for the range.
- Low Threshold
- Allows you to configure the lowest acceptable score for display purposes. The field accepts positive numeric values.
- Target
- Allows you to configure the optimal minimum score for display purposes. The field accepts positive numeric values.
Filter settings stay in effect after you have logged out of the inContact WFO Web Portal or moved to another page. The combination of Filter by and Criteria settings determine the data used in calculating each KPI. For example, if Agent and Joe Smith are selected, the KPI calculations are for the agent Joe Smith. Only the agents, inContact Groups, and evaluation forms to which you have access will be available in the widget.
Widget Display
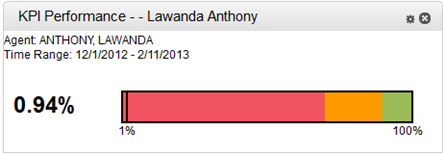
The KPI Performance widget displays QA performance of an agent or an inContact Group over a period of time. The average QA score for the period is shown as a percentage, and is calculated by dividing the (sum of awarded points for all evaluations fitting the selected criteria) by the (sum of possible points for all evaluations fitting the selected criteria).
The display shows the placement of the agent on a colored bar that represents these thresholds:
- Red — below the lowest acceptable low score (Low Threshold).
- Yellow — between the lowest acceptable low score and the optimal minimum score (Target).
- Green — above the optimal minimum score (Target).