inContact WFMv2 Administration > Organizational Settings > Contact Groups > Graph Contact Group Data
Graph Contact Group Data
Required Permission — WFM Permissions>Manage>Stream Data>Edit
Overview
Contact Groups are defined as a group of Streams. However, while Streams represent the data associated with different contact types, Contact Groups represent the agents associated with those contact types.
This topic explains how to graph Contact Group data in inContact WFMv2.
For more information, see Contact Groups Overview.
- Click WFOWFMv2 PortalManageStream Data.
- If you only have one Environment, skip to the next step. Otherwise, use the Select Environment drop-down list to select an Environment. You can alternatively choose to view Contact Group data for All Environments.
- For Select Scope, select Contact Group from the drop-down list (this is the default value).
- Click the Graph icon for the Contact Group you want to graph.
-
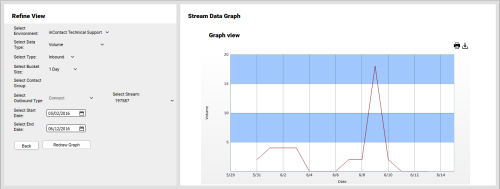
Optional: Refine View

To refine your graph of Contact Group data, do one or more of the following:
- For Select Environment, select from the drop-down list of available Environments.
- For Data Type, select one of the following from the drop-down list: Volume, Average Service Time, Contacts Handled, Contacts Abandoned, Average Speed of Answer, or Service Level.
- For Select Type, select either Inbound or Outbound from the drop-down list.
- For Select Bucket Size, choose from the drop-down list to change the data interval for your view. Choices range from 30 Minutes to 1 Year..
- For Select Contact Group, select one or more of the Contact Groups available for this Environment.
- Select Start Date and Select End Date to limit your view to a specific time period.
After making your selections, click Redraw Graph.
- Optional: To print the graphed data, click the Print icon at the upper right corner of the graph.
- Optional: To download the graphed data, click the Download icon at the upper right corner of the graph, and then click the icon for the appropriate file format.

