Forecasting > View Forecast Runs and Results
View Forecast Runs and Results
Required Permission — WFM Permissions>Forecaster>Forecast Runs>Create, WFM Permissions>Forecaster>Forecast Runs>View Others, or both
Overview
Forecasts are predictions of future call volume based on historical volumes. inContact WFMv2 offers a number of algorithms you can use to produce forecasts.
This topic explains how to view forecast runs and their results.
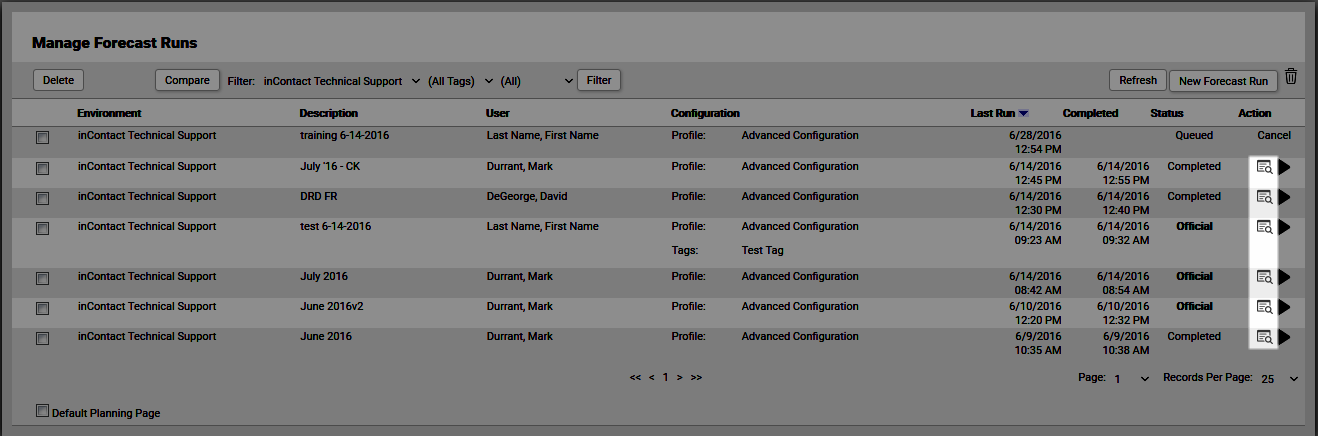
- Click WFOWFMv2 PortalForecasterManage Forecast Runs. Basic information about forecast runs, including their status, appears on this page.
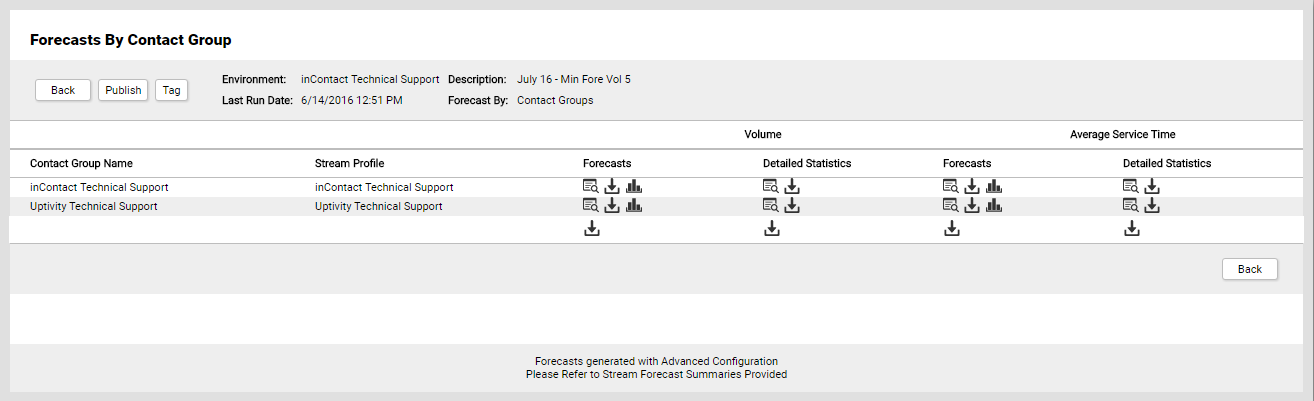
- Click the View icon for a forecast to open the Forecasts by Contact Group page shown at the beginning of this topic. You can only view forecast runs with a status of Completed, Published, or Official.
- Optional: To work with the forecast call volume for a Contact Group, click one or more of the following icons under Volume > Forecasts on the line for that group:
- Click the View icon to view the forecast results, to edit the Forecast Call Volume field, to edit the Forecast AST field, or any of these.
- Click the Download icon to download the forecast results as a comma-separated values (.csv) file.
- Click the Graph icon to view a graph of actual data vs. forecast results.
- Optional: To work with statistics for the forecast call volume for a Contact Group, click one or more of the following icons under Volume > Detailed Statistics on the line for that group:
- Click the View icon to view the statistics. Several additional reports can be accessed from the View Detailed Statistics page.
- Click the Download icon to download the statistics as a comma-separated values (.csv) file.
- Optional: To work with the forecast average service time (AST) for a Contact Group, click one or more of the following icons under Average Service Time> Forecasts on the line for that group:
- Click the View icon to view the forecast results, to edit the Forecast Call Volume field, to edit the Forecast AST field, or any of these.
- Click the Download icon to download the forecast results as a comma-separated values (.csv) file.
- Click the Graph icon to view a graph of actual data vs. forecast results.
- Optional: To work with statistics for the forecast AST for a Contact Group, click one or more of the following icons under Average Service Time > Detailed Statistics on the line for that group:
- Click the View icon to view the statistics. Several additional reports can be accessed from the View Detailed Statistics page.
- Click the Download icon to download the statistics as a comma-separated values (.csv) file.
- Optional: To download forecast call volume for all Contact Groups, click the Download icon under Volume on the line following the final group.
- Optional: To download statistics about the forecast call volume for all Contact Groups, click the Download icon under Detailed Statistics on the line following the final group.
- Optional: To download forecast AST for all Contact Groups, click the Download icon under Average Service Time on the line following the final group.
- Optional: To download statistics about the forecast AST for all Contact Groups, click the Download icon under Average Service Time > Detailed Statistics on the line following the final group.
- Click either Back button to return to the Manage Forecast Runs page.