

Configure Real-Time Widgets
Required permissions: Real-Time Dashboard Widget View
List of real-time widgets
- Agent Count by State
- Agent Counter
- Agent List
- Contact List
- Contact States by Skill
- Queue Counter
- Queue Trend
- Service Level
- Skill Summary
- Outbound Agent Performance (Personal Connection)
Each real-time widget contains options for configuring which data is included or excluded in the widget. For real-time widgets, a time frame cannot be specified for the data. Instead, the data is always updated and displayed every five seconds. In addition to determining which data is displayed, you can also select specific teams or agents for which to display data, change the title of the widget, and so forth.
- Click the app selector
 and select Reporting.
 - Click Dashboards.
- Select a dashboard from the Dashboard View drop-down.
- Click Edit to edit the dashboard.
-
 Click the settings cog in the corner of the widget that you want to configure.
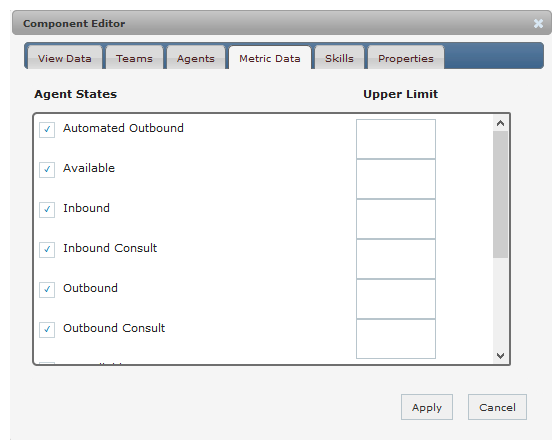
The following is an example of a settings window for the Agent List. You can see the different tabs which enable you to configure features of the widget, such as specific agents or skills, or actual data displayed. Available tabs in this window vary depending on the widget you are configuring; each widget does not have the same tabs.
- Make the necessary configuration changes, then click Apply.
Learn more about the tabs in the Settings window:
Tab Description Teams Select available teams for which to display data. Agents Select available agents for which to display data. Skills Select available skills for which to display data. Properties Edit the title of the widget. Metric Data Select which metrics to display in the widget. You can also set a data range for each metric. View Data Select one of the following data elements to display in the widget: Skill Name, State, Time, Agent, Campaign. Campaign Select available campaigns for which to display data. Interval Select a time interval for which to display data. Options are Last 30 Minutes or Current day starting at 12pm. Media Options to display data for specific media types (available channels) such as chat or phone. Inbound/Outbound Options to display data for specific contact types: Inbound, Outbound, Inbound & Outbound. Turn red at Allows you to determine a threshold at which the trend turns red, indicating a bad trend. Available for the Queue Trend widget. Time Period Allows you to set a time each day for the widget data to reset. Available for the Outbound Agent Performance widget. Other Customize the interval parameters for displaying data. - Click Save on the Dashboard toolbar.
Configure Historical Widgets
Required permissions: Historical Dashboard Widget View
List of historical widgets
Each historical widget contains options for configuring the widget, specifically the date range of the historical data, or which data is included or excluded in the widget. In addition to determining which data is displayed, you can also select specific teams or agents for which to display data, change the title of the widget, and so forth. To configure your historical widget:
- Click the app selector and select Reporting.
- Click Dashboards.
-
Select a dashboard from the Dashboard View drop-down.
- Click Edit to edit the dashboard.
-
Click the settings cog in the corner of the widget that you want to configure.
The following is an example of a settings window for the Agent List. You can see the different tabs which enable you to configure features of the widget, such as specific agents or skills, or actual data displayed. Available tabs in this window vary depending on the widget you are configuring; each widget does not have the same tabs.
- Configure the options for the selected widget and click Apply. Notice that historical widgets offer the Date Range tab.
Learn more about the tabs in the Settings window:
Tab Description Date Range Allows you to determine a specific date range from which to pull data. You can set a custom date range or choose a default option, such as Last 7 Days. Teams Select available teams for which to display data. Agents Select available agents for which to display data. Skills Select available skills for which to display data. Properties Edit the title of the widget. Metric Data Select which metrics to display in the widget. You can also set a data range for each metric. View Data Select one of the following data elements to display in the widget: Skill Name, State, Time, Agent, Campaign. Campaign Select available campaigns for which to display data. Interval Select a time interval for which to display data. Options are Last 30 Minutes or Current day starting at 12pm. Media Options to display data for specific media types (available channels) such as chat or phone. Inbound/Outbound Options to display data for specific contact types: Inbound, Outbound, Inbound & Outbound. - Click Save on the Dashboard page.
Print the Current Widget View
Required permissions: Real-Time Dashboard Widget View or Historical Dashboard Widget View
You can print the data that a widget is currently displaying. You can click the printer icon in the upper-right corner of a widget to open your computer's default printer options. The printer icon displays when viewing a dashboard in standard mode; when editing a dashboard, this icon is replaced by the Settings and Delete buttons. If a widget does not have a print icon, then it does not have printing capability.
Customize the Unavailable State Thresholds for Agent List Widget
Required permissions: Agent List Report View
You can customize the unavailable state thresholds for the Agent List widget. This allows you to quickly see if an agent has exceeded a threshold. For example, if you configured a Lunch unavailable state, you can set a threshold for 1 hour. If an agent is in the Lunch unavailable state for longer than an hour, it will become highlighted in red.
- Click the app selector and select Reporting.
- Click Dashboards.
- In the Dashboard drop-down, select your dashboard.
- Click Edit.
- In the Agent List widget header, click the Settings cog. If the Agent List widget is not on your dashboard, click and drag it onto the dashboard from the list of real-time widgets, then click the Settings cog.
- Click the Metric Data tab, which displays all existing unavailable states.
- For each unavailable state that you want to display in the widget, click the checkbox beside the state name. A correlating empty box will appear adjacent the state name.
- Click inside the empty box for the desired state, which displays the Choose Time panel.
- Use the sliders to set the desired time amount for that threshold.
- Click Done.
- Repeat for all desired unavailable states.
- Click Apply.
- Click Save in the Dashboard header.