Required permissions: Agent Performance By Hour View
Refresh rate: 15 minutes
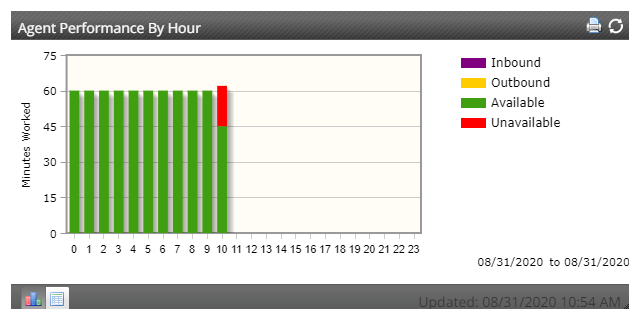
The Agent Performance by Hour widget displays the amount of time the selected agents spent in agent application state![]() The availability status of an agent. types throughout each hour of the day. The x-axis displays 24 increments, representing the 24 hours in a single day. The y-axis indicates the range of total minutes worked by selected agents. You can select specific agents or entire teams for which to display data, along with the standard time-range options. If you select a date range, rather than a single day, the graph will maintain the 24 x-axis increments and combine the total amount of minutes for each state in each hour of the day. For example, say you wanted to display data for agents who worked during the previous weekend. You could start by selecting those two specific days as a custom date range. Also, suppose your contact center was open from 8am-8pm on both weekend days. The x-axis would keep the 24 hourly increments, but beginning with the 8th increment, the widget would combine the total minutes worked for the 8am-9am hour on both days, and display it in the 8th place.
The availability status of an agent. types throughout each hour of the day. The x-axis displays 24 increments, representing the 24 hours in a single day. The y-axis indicates the range of total minutes worked by selected agents. You can select specific agents or entire teams for which to display data, along with the standard time-range options. If you select a date range, rather than a single day, the graph will maintain the 24 x-axis increments and combine the total amount of minutes for each state in each hour of the day. For example, say you wanted to display data for agents who worked during the previous weekend. You could start by selecting those two specific days as a custom date range. Also, suppose your contact center was open from 8am-8pm on both weekend days. The x-axis would keep the 24 hourly increments, but beginning with the 8th increment, the widget would combine the total minutes worked for the 8am-9am hour on both days, and display it in the 8th place.
Note that individual agents cannot be selected when generating data for teams, and teams cannot be selected when generating data for individual agents. Also, the graph autoscales based on the y-axis to maintain a consistent widget size, regardless the determined time range.