

This help page is for Desktop Studio. This information is also available for Studio.
Vous pouvez déboguer des extraits à partir de la fenêtre de l’éditeur
- Vérifier la syntaxe dans l’extrait de code. Vous pouvez le faire à tout moment pendant le codage d’un extrait de code. Cette option n’utilise pas l’outil de débogage.
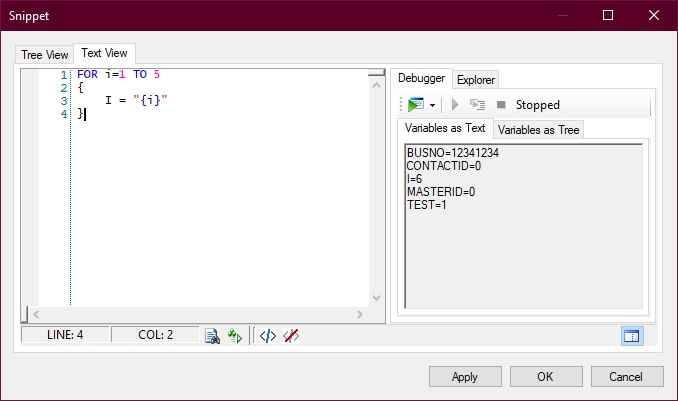
- Déboguer l’ensemble de l’extrait de code pour voir les variables et leurs valeurs après l’exécution de l’ensemble de l’extrait de code.
- Définir un point d’arrêt pour arrêter le débogage à une certaine ligne du code.
- Parcourir chaque ligne de l’extrait de code et observer comment les variables et leurs valeurs changent ligne par ligne.
- Utiliser les instructions TRACE pour produire des données dans le volet
En outre, si votre code contient des objets dynamiques ou des tableaux, vous pouvez afficher leur contenu et voir comment il change.
Vérifier la syntaxe de l’extrait de code
Vous pouvez demander à Studio de vérifier la syntaxe d’un extrait de code.
- Dans Studio, ouvrez un script contenant une action Snippet.
- Double-cliquez sur l’action Snippet.
- Ajoutez le code Snippet dans l’onglet
-
Cliquez sur l’icône Check Syntax
 en bas de la fenêtre de l’éditeur
 Si aucune erreur de syntaxe n’est trouvée, le champ d’état situé à côté de l’icône Vérifier la syntaxe affiche le message Okay.
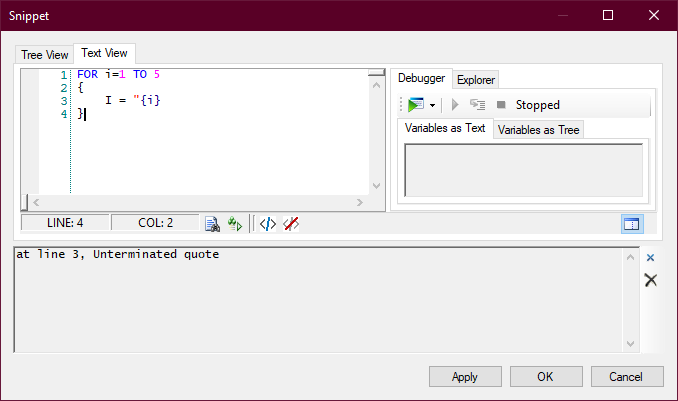
Si des erreurs de syntaxe sont détectées, un message d’erreur s’affiche, décrivant l’erreur. La description comprend le numéro de ligne où se trouve l’erreur. En outre, le champ d’état situé à côté de l’icône de vérification de la syntaxe affiche le message suivant : Error at line [#].
- Corrigez les problèmes de syntaxe détectés.
- Vous pouvez sélectionner une ou plusieurs lignes dans le code de l’extrait et cliquer sur l’icône Comment out selected lines
 . Cette fonction est utile si vous souhaitez ignorer une erreur et vérifier les autres erreurs.
 - Vous pouvez sélectionner une ou plusieurs lignes commentées dans le code de l’extrait et cliquer sur l’icône Uncomment the selected lines
 .
.
Utiliser l’outil de débogage
- Dans Studio, ouvrez un script contenant une action Snippet.
- Double-cliquez sur l’action Snippet.
- Ajoutez le code Snippet dans l’onglet
- Dans la partie droite de la fenêtre
- Cliquez sur la flèche descendante à droite de l’icône Debug
 et sélectionnez Start
 .
. -
Si le code contient des erreurs de syntaxe, la fenêtre
- Corrigez les erreurs.
- Lorsque les erreurs ont été corrigées, cliquez sur les icônes Close ou Clear Trace Output
 pour fermer le volet d’erreurs.
 - Redémarrez le débogueur.
- Consultez le contenu de l’onglet
- Vous pouvez sélectionner une ou plusieurs lignes dans le code de l’extrait et cliquer sur l’icône Comment out selected lines . C’est utile si vous voulez supprimer du code pour voir comment le résultat du débogage change.
- Vous pouvez sélectionner une ou plusieurs lignes de code commentées et cliquer sur l’icône Uncomment the selected lines pour ajouter ces lignes dans l’extrait de code.
Déboguer avec un point d’arrêt
Vous pouvez définir un point d’arrêt si vous souhaitez que le débogage s’arrête à une ligne spécifique du code de l’extrait. Cela vous permet de voir les variables et les valeurs à mi-chemin de l’extrait sans avoir à le parcourir ligne par ligne.
- Dans Studio, ouvrez un script contenant une action Snippet.
- Double-cliquez sur l’action Snippet.
- Ajoutez le code Snippet dans l’onglet
-
Cliquez dans la colonne à gauche des numéros de ligne dans la fenêtre
- Dans la partie droite de la fenêtre
- Cliquez sur la flèche descendante à droite de l’icône Debug et sélectionnez Start.
-
Si le code contient des erreurs de syntaxe, la fenêtre
- Corrigez les erreurs.
- Lorsque les erreurs ont été corrigées, cliquez sur les icônes Close ou Clear Trace Output pour fermer le volet d’erreurs.
- Redémarrez le débogueur.
- Consultez le contenu de l’onglet
- Si vous avez terminé avec le point d’arrêt, cliquez à nouveau sur le cercle rouge pour l’effacer.
- Placez un autre point d’arrêt, si vous en avez besoin.
- Pour poursuivre le débogage à partir du point d’arrêt, cliquez sur l’icône Resume
 .
. - Pour arrêter le débogage, cliquez sur l’icône Stop Debugging
 .
.
Entrer par le code de l’extrait
Vous pouvez utiliser l’outil de débogage pour parcourir le code de l’extrait ligne par ligne. Cela vous permet de voir comment les variables et leurs valeurs changent au fur et à mesure de l’exécution de chaque ligne.
- Dans Studio, ouvrez un script contenant une action Snippet.
- Double-cliquez sur l’action Snippet.
- Ajoutez le code Snippet dans l’onglet
- Dans la partie droite de la fenêtre
- Cliquez sur la flèche descendante à droite de l’icône Debug et sélectionnez Start.
-
Si le code contient des erreurs de syntaxe, la fenêtre
- Corrigez les erreurs.
- Lorsque les erreurs ont été corrigées, cliquez sur les icônes Close ou Clear Trace Output pour fermer le volet d’erreurs.
- Redémarrez le débogueur.
- Consultez le contenu de l’onglet
- Cliquez sur l’icône Step
 pour passer à la ligne suivante dans l’extrait.
 - Répétez les deux étapes précédentes pour chaque ligne de l’extrait.
- Si vous voulez sauter les lignes de code restantes, cliquez sur l’icône Resume . L’onglet
- Pour arrêter le débogage, cliquez sur l’icône Stop Debugging , puis répétez ce processus à partir de l’étape 3.
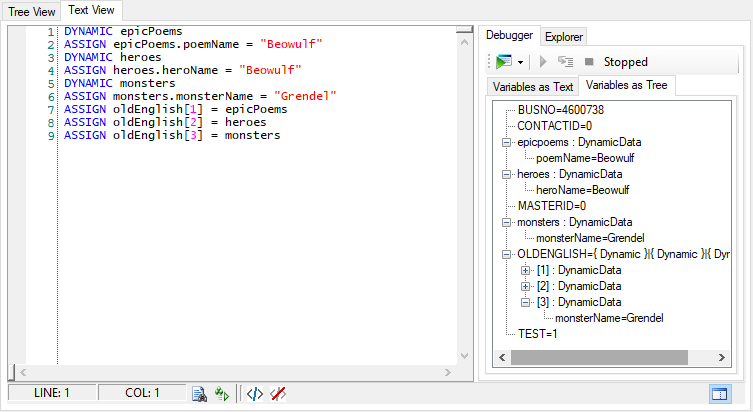
Afficher le contenu des objets dynamiques et des tableaux
Vous pouvez afficher le contenu des objets dynamiques dans la fenêtre de l’éditeur
- Dans Studio, double-cliquez sur une action
- Ajouter un extrait de code, si nécessaire.
- Dans l’onglet
- Dans l’onglet et sélectionnez Entrer dans . Si vous ne souhaitez pas parcourir le code ligne par ligne, cliquez sur l’icône Commencer le débogage.
- Cliquez sur l’icône Étape et observez le contenu de l’onglet
- Lorsque vous avez parcouru toutes les lignes de code ou si vous avez cliqué sur Commencer le débogage, l’onglet
-
Vous pouvez cliquer sur l’icône + à côté des tableaux de chaînes ou des objets dynamiques dans le code pour les développer. Si le contenu est un autre tableau ou objet, vous pouvez continuer à développer l'arborescence pour voir ce que contient chaque entité.
Déboguer à l’aide de TRACE
Le mot-clé
Le mot-clé
La syntaxe est la suivante : TRACE "<text>"
Le texte entre guillemets est affiché dans la fenêtre de l’éditeur
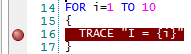
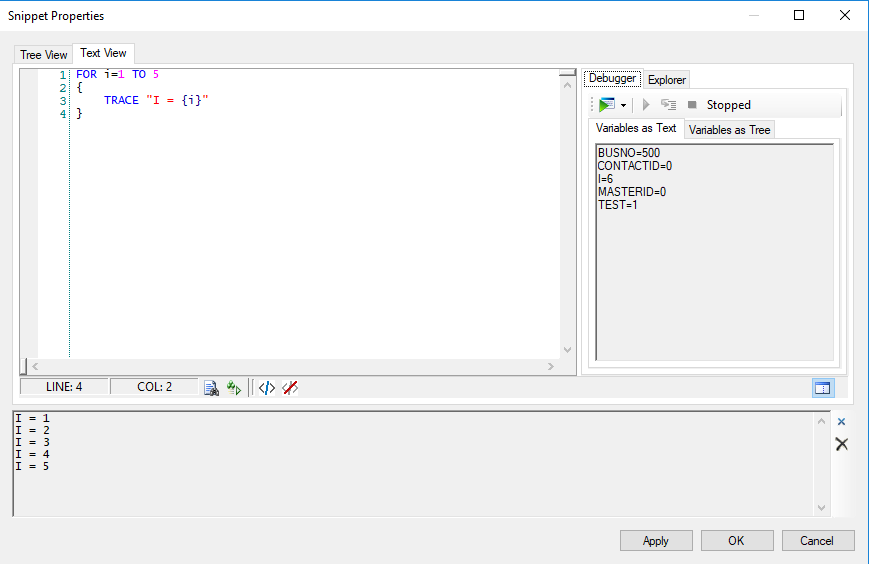
Vous pouvez utiliser la substitution de variables entre les guillemets pour imprimer la valeur des variables. Par exemple :
FOR i=1 TO 5
{
   TRACE "I = {i}"
}
Le résultat de cet exemple est le suivant :
I = 1
I = 2
I = 3
I = 4
I = 5
Utiliser la variable système de test
La variable est une variable système réservée à l'utilisation dans le débogage des extraits. Il vous permet de définir la valeur des variables qui sont utilisées dans l'extrait et qui seraient déjà remplies par le script avant qu'il n'atteigne l'action .
Lorsque vous utilisez dans un extrait, il doit être utilisé dans le cadre d'une instruction et défini sur 1. Le code entre les accolades ne s'exécute que lorsque vous exécutez le débogueur d'extraits, car la variable n'est égale à 1 que lorsque le débogueur s'exécute. Lorsque le script s'exécute pour un contact![]() La personne qui interagit avec un agent, un IVR ou un robot dans votre centre d’appels., a la valeur 0, donc le code entre les accolades dans l'instruction est ignoré.
La personne qui interagit avec un agent, un IVR ou un robot dans votre centre d’appels., a la valeur 0, donc le code entre les accolades dans l'instruction est ignoré.
- Dans CXone Mpower, cliquez sur le sélecteur d’application
 et sélectionnezRoutage omnicanal > Studio
  .
. - Sur la page Scripts, localisez le script avec lequel vous voulez travailler et double-cliquez dessus pour l’ouvrir. Le script s’ouvre dans un nouvel onglet.
-
Ouvrez une action ou ajoutez-en une nouvelle au canevas.
-
Click the Text View tab.
-
En haut de la fenêtre , ajoutez le code suivant :
-
Au lieu de , insérez le code ou les instructions dont vous avez besoin pour définir les conditions initiales requises pour l'exécution de l'extrait.
-
Ajoutez tout autre code requis par l’extrait.
-
Pour tester le code, cliquez sur le bogue
 pour ouvrir le débogueur.
 -
Cliquez sur Appliquer pour sauvegarder l'extrait, puis enregistrez votre script.