

It's expected to experience some customer frustration![]() Different from negative sentiment. Frustration cues show that a customer is upset rather than just discussing something negative. in your contact center. But how can you identify and address issues causing excessive frustration? Follow this success guide to design a workspace focused on client frustration. Reducing frustration can benefit your organization in the following ways:
Different from negative sentiment. Frustration cues show that a customer is upset rather than just discussing something negative. in your contact center. But how can you identify and address issues causing excessive frustration? Follow this success guide to design a workspace focused on client frustration. Reducing frustration can benefit your organization in the following ways:
-
Improve customer satisfaction: Analyzing frustration can help identify issues and mitigate negative customer experiences.
-
Reduce risk of customer loss: You can enhance agent training, improve business processes, and fix product issues. The better the customers’ experience, the more likely they are to stay.
-
Better agent experience: Mitigating customer frustration improves the agent experience too. Their jobs are less stressful when they don't have to deal with as many frustrated customers.
Classics, Inc. wants to identify what things are causing customer frustration. They want to compare the frustration data of two teams with similar skills from different locations. The Kansas team is new with less-experienced agents. The Emerald City team has existed longer and has more-experienced agents. They are interested in discovering:
- Business processes upsetting customers.
- Agent communication or knowledge gap issues upsetting customers.
- Product issues frustrating customers.
How Frustration is Defined
Frustration in NiCE CXone Interaction Analytics (CXone) (IA) is determined by language cues in interaction transcripts. These cues are words and phrases that indicate customer frustration. Frustration cues help detect issues such as process inefficiencies, product issues, broken promises, and highly negative statements. Some cues are weighted more heavily than others.
IA uses machine learning to determine whether the type and number of issues found exceeds a normal level of frustration. For example, a customer could say I called three times, and am still waiting for a reply and be reporting facts, with no emotional distress. But, if they also say things like this is really annoying and I can't believe you guys, IA can detect and differentiate the severity of these complaints.
Set Up a Frustration Workspace
These instructions are a recommendation for how to build a workspace![]() Named view of one or more widgets.. They're meant to help you get started. You can customize workspaces in many other ways to suit your organization's needs. You can configure a dataset workspace using other widgets
Named view of one or more widgets.. They're meant to help you get started. You can customize workspaces in many other ways to suit your organization's needs. You can configure a dataset workspace using other widgets![]() Graphical representation of data that meets specified filter criteria., metrics
Graphical representation of data that meets specified filter criteria., metrics![]() Statistics you can measure to keep track of your contact center., and filters not mentioned here.
Statistics you can measure to keep track of your contact center., and filters not mentioned here.
Be sure to configure categories ![]() Data groups that Interaction Analytics (CXone) uses for parsed call transcript data. They make it easier to find trends. to analyze your data. Categories and category sets
Data groups that Interaction Analytics (CXone) uses for parsed call transcript data. They make it easier to find trends. to analyze your data. Categories and category sets![]() Category groupings that help you use data for a specific purpose. Out-of-the-box category templates include Intent to Buy and Risk Aversion. help you group and identify information most relevant to your interests. We recommend using the Contact Center Highlights category with this workspace. Note that you must click Update Data on the Language Model page to apply any changes you make to categories. This causes a reprocess which can take several hours to complete. You can monitor the Reprocess Status in the bottom of the left navigation menu in Interaction Analytics (CXone).
Category groupings that help you use data for a specific purpose. Out-of-the-box category templates include Intent to Buy and Risk Aversion. help you group and identify information most relevant to your interests. We recommend using the Contact Center Highlights category with this workspace. Note that you must click Update Data on the Language Model page to apply any changes you make to categories. This causes a reprocess which can take several hours to complete. You can monitor the Reprocess Status in the bottom of the left navigation menu in Interaction Analytics (CXone).
Create the Workspace
- To begin, go to My Data and open the dataset you want to analyze.
- Click the workspaces panel
 if it is not already open, then click Add Workspace.
 - Click the Widget Drawer
 .
. - Select the following widgets in order, to add them to your workspace:
Overview Bar, under the Volume section.
Channels, under the Volume section.
Top Categories, under the Volume section.
Frustrated Interactions, under the Frustration section.
Frustration Trend, under the Frustration section.
Metrics, under the Volume section. Select this widget a second time, so that two appear in your workspace.
Unresolved, under the Volume section.
What People Are Talking About, under the Sentiment section.
Silence Percentage, under the Volume section.
Some of these widgets require more configuration after you add them to the workspace. This is so you can view specific data related to frustration. Other widgets use the default settings.
- You can edit any of the widgets to adjust their size or position.
Configure Metrics Widgets
Configure one Metrics widget to display the interactions by team. Configure the second one to display interactions by skill.
- Click more options
 > Settings in the top right corner of the first Metrics widget.
 - You can give the widget a new Title, such as Teams.
- Click the Widget Options drop-down.
- Under Field, select Team Name.
- For Number to Show, enter a number from 1–25, the number of teams you want the widget to display data for. The default is 10.
- You can customize the bar color or order in which the bars display in the widget. Configure each Metrics widget with a different color, so you can easily tell them apart.
- Click OK.
- Repeat these steps for the second Metrics widget but for Field, select Skill Name. You can make the same customizations and give the widget a new Title, such as Skills.
Depending on the needs of your organization, Agent Name may be a more useful metric to use instead. You can use the Agent Name metric in place of either Team Name or Skill Name as you see fit.
Configure the What People Are Talking About Widget
Configure the What People Are Talking About widget to only display entity types you are interested in. This will make it easier to see terms relevant to frustration in the word cloud.
-
Click more options
> Settings in the top-right corner of the widget. -
Click the Widget Options drop-down to Select entity types.
-
To only see terms from certain entity types, check the boxes next to the terms you're interested in.
- Click OK.
Filter by Frustration
You can filter your workspace![]() Named view of one or more widgets. to only see interactions where the contact was frustrated. The Frustration Trend widget and the Frustrated Interactions widget already display frustrated data. But if you apply a frustration workspace filter, all widgets will only display data from frustrated interactions. This is helpful to narrow your analysis and discover common causes of frustration.
Named view of one or more widgets. to only see interactions where the contact was frustrated. The Frustration Trend widget and the Frustrated Interactions widget already display frustrated data. But if you apply a frustration workspace filter, all widgets will only display data from frustrated interactions. This is helpful to narrow your analysis and discover common causes of frustration.
-
Click
 in the top right corner of your workspace. The Date Range drop-down and the Add Filters button appear.
 -
Click Add Filters and select Frustration.
-
Expand the Frustration filter you just added again and select Frustrated.
-
Click
 . The widgets in the workspace update to only display data for frustrated interactions.
You can also access and apply filters to individual widgets instead of the whole workspace. Click in the top right corner of a widget and follow the same steps.
How to Use a Frustration Workspace
Start by developing a theory about frustration. Predict when and how much frustration you think is to be expected for interactions for your organization. Then estimate how much frustration you think exists in your interactions. Establish a baseline for your overall frustration percentage using the Analytics Metric Statistics report. Also, consider what specific processes or behaviors might be frustrating customers. Each widget displays details to help you test your theory. Compare widgets side by side to see specific issues. Your observations help you determine what filters can identify areas for improvement. The widget data that displays in the workspace![]() Named view of one or more widgets. depends on the dataset parameters selected for the dataset.
Named view of one or more widgets. depends on the dataset parameters selected for the dataset.
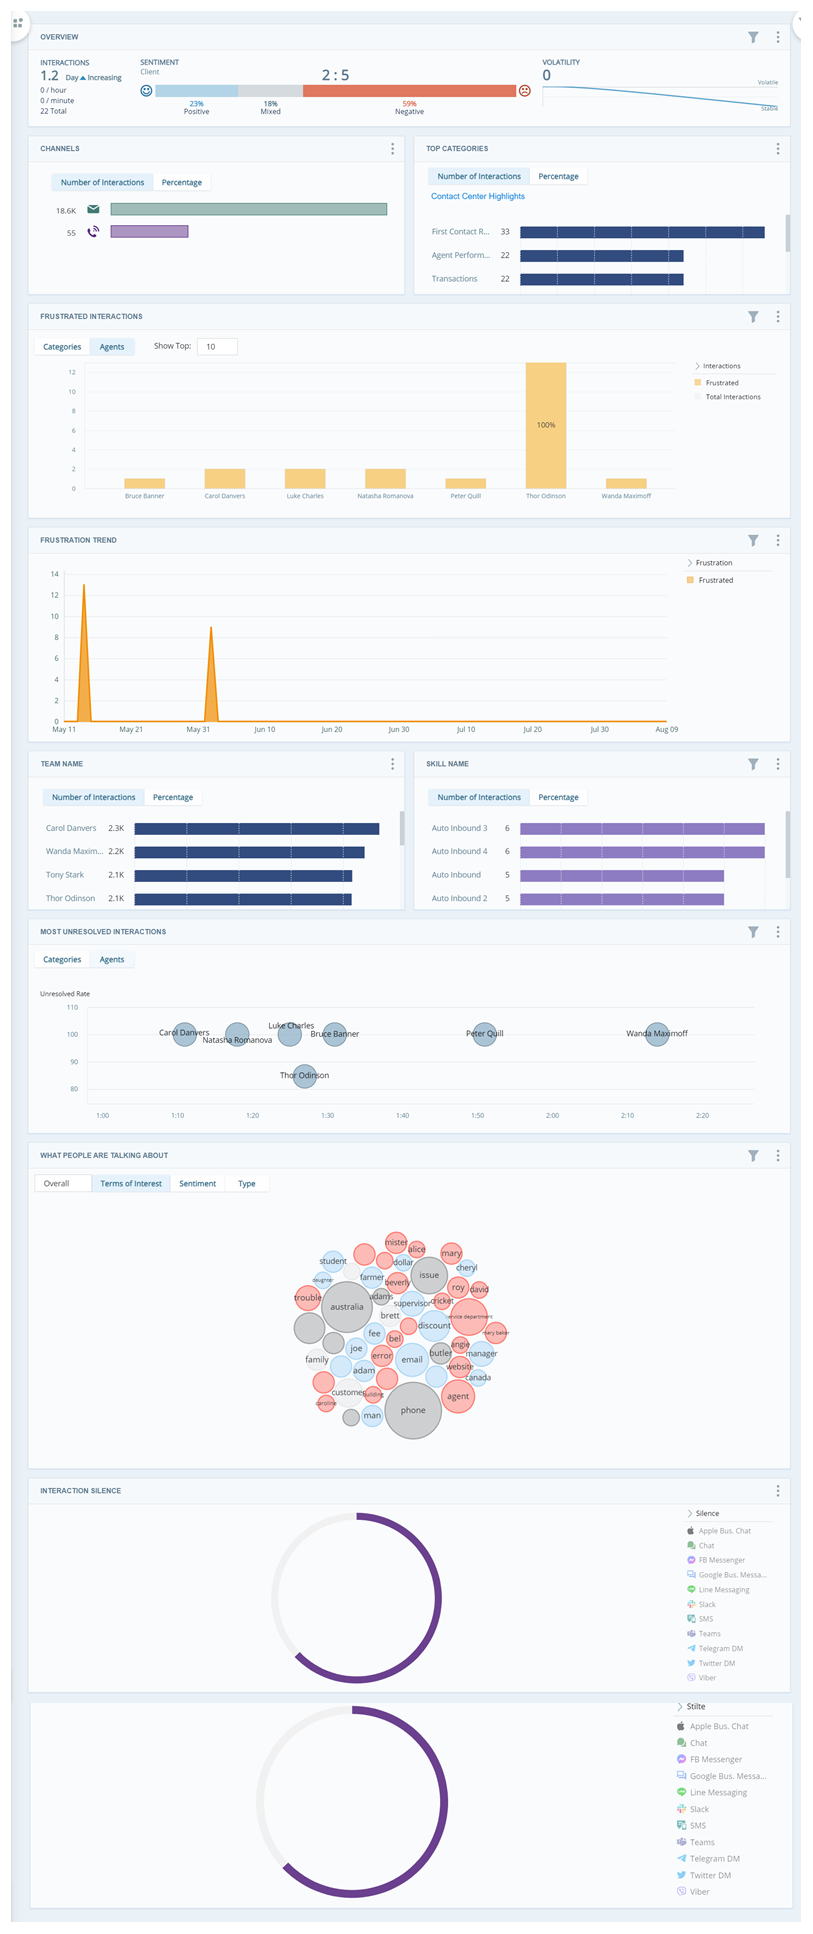
Overview Bar Widget
The Overview Bar widget gives you a general idea of sentiment![]() Overall mood or result of the interaction as determined by analysis of words, phrases, and context of the transcript. is trending throughout all interactions in the dataset. While sentiment and frustration
Overall mood or result of the interaction as determined by analysis of words, phrases, and context of the transcript. is trending throughout all interactions in the dataset. While sentiment and frustration![]() Different from negative sentiment. Frustration cues show that a customer is upset rather than just discussing something negative. are different, they often correlate. So, negative sentiment may also help you learn about frustration in your contact center.
Different from negative sentiment. Frustration cues show that a customer is upset rather than just discussing something negative. are different, they often correlate. So, negative sentiment may also help you learn about frustration in your contact center.
Channels Widget
The Channels widget shows the number of interactions by source. This is helpful to see what methods you use most often to communicate with customers. If there are a high number of frustrated interactions from a certain source, it may be helpful to look for channel specific issues frustrating users.
Click any bar in the widget to see interaction details and transcripts for a channel. Review individual interactions to discover new insights.
Top Categories Widget
The Top Categories widget shows the top categories for interactions in the dataset. By default, the widget displays categories listed on the Language Model page. You should have Contact Center Highlights selected. This category set is helpful to focus on processes, policies, or agent behaviors that may be causing frustration. It includes the following categories:
-
Accounts
-
Agent Performance Negative
-
Agent Performance Positive
-
Billing
-
Escalation
-
First Contact Resolution
-
General Inquiries
-
Self-Service
-
Transactions
Make sure to filter the widget or workspace to only show frustrated interactions, so the widget only displays categories associated with frustration. Review the widget to see which categories have the most frustrated interactions. Each of these categories also has more specific subcategories that you can drill into. To investigate further, click the bar of any category and select Drill to [Category]. You can also view individual call recordings and transcripts if you click a bar and select Show Interactions.
A data analyst at Classics, Inc. uses the Contact Center Highlights category set for the dataset. Next they filter the workspace to only see frustrated interactions. They notice that the category Agent Performance Negative has the most frustrated interactions. They click on the category bar and select Drill to Agent Performance Negative to see its subcategories. Agent Not Knowledgeable is the subcategory with the most interactions. The analyst clicks the category bar again and selects Show Interactions to investigate why. They listen to call recordings and read interaction transcripts to discover areas where agents aren't knowledgeable. They find that several agents are telling customers to call back later or are taking long amounts of time to explain the billing process for a new product.
Frustrated Interactions Widget
The Frustrated Interactions widget displays the top 10 agents or categories with the highest percentage of frustrated interactions. You can toggle between the Agent and Categories views in the widget. Since the Top Categories widget already displays information for frustrated categories, it may be more helpful to focus on the Agent view. Note that if the workspace is filtered to only show frustrated interactions, the widget will display 100% for each of the top 10 agents instead of their actual percentage of total interactions. However, if you click on an agent's bar you can still see specific details such as the exact number of calls they've handled and the top categories for their interactions.
Look for common categories across the top 10 agents to see what topics often cause frustration. Review individual interaction transcripts to identify what additional training could benefit each agent.
Frustration Trend Widget
The Frustration Trend widget tracks frustrated and non-frustrated interactions over time. The graph makes it easy to identify patterns as well as abnormal spikes in frustration. If you identify a time period with a spike in frustration, it indicates a date range to investigate.
Change the Date Range in the workspace filters to only include interactions that occurred during the period you want to investigate. Once the new Date Range is set, filter the workspace to only show frustrated interactions. Review the rest of the workspace to take a closer look at what's occurring during this specific time period.
Step back to consider the category you’re in and create a hypothesis for why the spike occurred. Review specific interactions to confirm or refute your guess.
A data analyst at Classics, Inc. reviews the Frustration Trend widget and notices a huge spike in frustration during the month of June. They adjust the Date Range at the top of the workspace to only show data for the month of June. They click on a day in the graph with the most frustrated interactions to view individual transcripts. They notice that most of these interactions mention the same new product. They continue to review other interaction details to discover why the new product is causing frustration.
Metrics Widgets
The Metrics widget can be helpful to view the overall volume of your frustrated interactions. It can point you to which teams, agents, or skills have the highest frustration. This may be a helpful indication of agents and teams who need coaching. However, high volume of frustrated interactions isn't necessarily a reflection of agent performance. High frustration for a particular team could also help identify location-specific issues. These are possibilities to consider when analyzing your data but be sure to investigate further. Review individual interactions before drawing conclusions. You can click more options > Settings in the widget to edit the display. You can also click on any of the bars in the widget and click Show Interactions to see more details.
Most Unresolved Interactions Widget
The Most Unresolved Interactions widget displays the most common unresolved interactions in your contact center. The widget offers both a category view and agent view. The chart displays categories by average talk time. The category view demonstrates what kinds of issues are often not resolved in a single interaction.
Unresolved interactions may be a source of frustration for customers. Review agents and categories with the most unresolved interactions to identify topics and behaviors causing frustration. Click on individual bubbles in the chart to drill down further or review individual transcripts.
What People Are Talking About Widget
The What People Are Talking About widget displays the top 50 entities![]() Keyword or phrase defined in your company profile in Interaction Analytics (CXone). Related to an entity type. Can include variants. used most frequently in the interactions in the dataset. Filter the workspace to only show frustrated interactions, so that the widget will only display terms related to frustration. Pay attention to terms that could communicate frustration. Utilize the different view options to sort terms by Sentiment or Type. Red term bubbles associated with negative sentiment
Keyword or phrase defined in your company profile in Interaction Analytics (CXone). Related to an entity type. Can include variants. used most frequently in the interactions in the dataset. Filter the workspace to only show frustrated interactions, so that the widget will only display terms related to frustration. Pay attention to terms that could communicate frustration. Utilize the different view options to sort terms by Sentiment or Type. Red term bubbles associated with negative sentiment![]() Overall mood or result of the interaction as determined by analysis of words, phrases, and context of the transcript. may also correlate with frustration. Reviewing terms by type can also highlight specific entity types or topics causing frustration.
Overall mood or result of the interaction as determined by analysis of words, phrases, and context of the transcript. may also correlate with frustration. Reviewing terms by type can also highlight specific entity types or topics causing frustration.
As you review the data in other widgets throughout the workspace, you may discover that some entity types are of more interest to you than others. You can edit the Widget Options to change the terms that appear in the word cloud.
To hide irrelevant terms, click the term and then Hide. To take a closer look at individual interactions where certain words appear, click the term and then Show Interactions.
If you select Exclude instead of Hide, the phrase is added to the Entities workspace filter. This means that any interaction including the phrase is excluded from the widget as well as the workspace. Keep this in mind when you want to remove irrelevant phrases from the widget but keep the interactions where these entities are stated.
A data analyst at Classics, Inc. reviews the What People Are Talking About widget to look for the most common company profile entities mentioned. They edit the Widget Options to only display terms and phrases for the Billing Issue, Brand, Product, and Company entity types. They click the Type view to see which terms appear for topics that could cause frustration. Then they focus on the red bubbles with terms associated with negative sentiment. They review interactions for the biggest bubbles because that means these terms are mentioned more often. The analyst realizes that several interactions mention Classics' new product.
Interaction Silence Widget
The Interaction Silence widget displays extended periods of silence as a percentage of the total interaction time in chat and voice interactions.
Interactions with a high silence percentage could indicate that an agent isn't knowledgeable or spends a lot of time looking for answers. It might also indicate uncomfortable silences after a customer expresses frustration. Click on circles in the chart to view individual interactions and investigate how long silences may demonstrate frustration.
Measure and Track Progress
A goal-focused workspace is most valuable when your insights are used to drive change. Be sure to measure and track your progress on a regular basis. This helps you see how you are improving and helps you set appropriate goals.
A Classics, Inc. analyst used this frustration workspace to compare the Emerald City and Kansas teams. They discovered a large spike in customer frustration during the launch month of a new product. The analyst reviewed widget data and individual interactions to investigate this spike. They discovered that:
- Customers were confused about the billing process for the new product.
- Customers were upset about the unclear product documentation.
- Agents on the Kansas team weren't as knowledgeable about the new billing process.
In response to what they found, Classics updated the information on their website and marketing materials to better explain the new billing process. They also enhanced agent training on the new product.
A month later, Classics ran the Metric Comparison report. It showed that the Kansas team improved, and that overall frustration was lower.
Run the Analytics reports to view your progress. You could view data on a monthly basis or after a coaching session to track progress. Each time you run an Analytics report, you can compare that data to your baseline to measure your progress. Based on your improvements, you may also decide to use updated data to establish a new baseline to measure against. After you review insights from the workspace and Analytics reports, consider what milestones and supporting goals should come next to maintain a process of continuous improvement.
Assess Agents in Smaller Groups
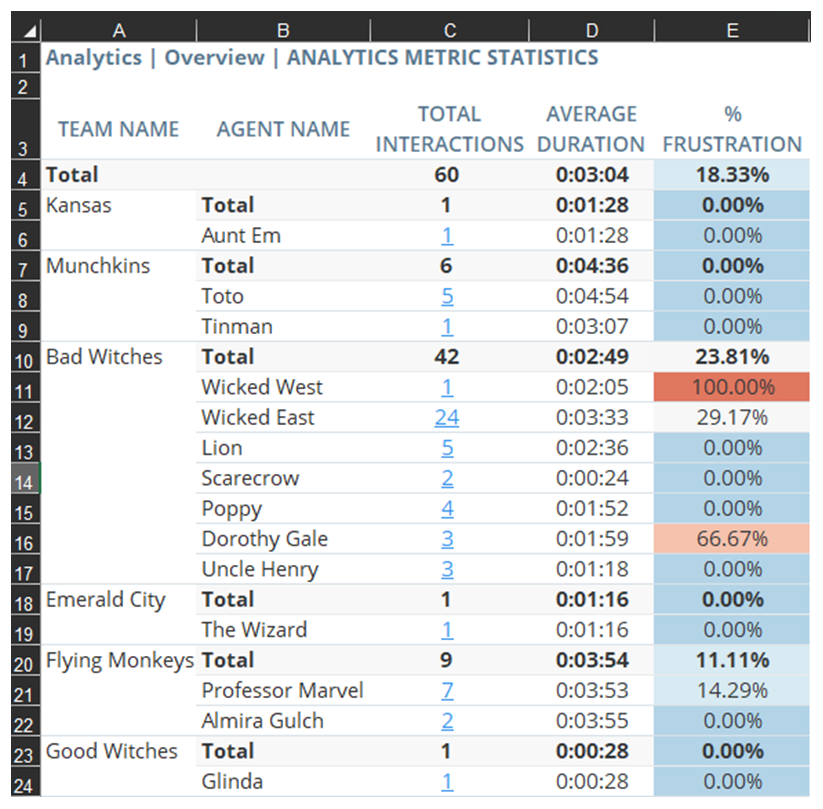
After you establish a baseline for frustration, you can discover additional insights by sorting agents by score. This can be helpful after establishing a baseline for the first time or after tracking progress and establishing a new baseline. The baseline gives you an idea of what average frustration is in your contact center. Use Analytics reports, Excel, and the Frustration workspace you created to see which agents have higher or lower than the average frustration percentage. This method helps you perform more advanced analysis and track progress on a more granular level.
-
Run the Analytics Metric Statistics report for the time period you would like to review.
-
Expand the Metrics drop-down and select the checkboxes for Total Interactions, Average Duration, and % Frustration. You can select any of the other metrics you would also like to review, but the purpose of this guide is to focus on frustration.
-
Click OK.
-
-
Export the report.
-
Click Share
 in the top right corner of the report.
 -
Click Export to Excel.
-
Select your desired Range from the drop-down. You can choose to only view the grids on the page you are viewing or data from the entire report.
-
Click Export.
-
-
Review the exported data in Excel and arrange agents into four equal groups based on their percentage of frustrated interactions. Rearrange the columns in Excel so that you have agents sorted into the following groups:
-
Low percentage of frustrated interactions
-
Lower than average percentage of frustrated interactions
-
Higher than average percentage of frustrated interactions
-
High percentage of frustrated interactions
-
-
Review the Excel sheet for commonalities and differences between these groups. Note agents with higher frustration. Decide how to investigate further by identifying the agent, team, or interactions with the most frustration to determine what’s causing it. Also note agents with the lowest frustration. You can analyze what they are doing well. Once you've made observations based on the export data, use the Frustration workspace to investigate further.
Identify Individualized Training Opportunities
Once you have sorted agents into groups based on their frustration percentage, use the Frustration workspace to perform more detailed analysis. Filter the workspace to view data for each group at a time. Use the metrics and widgets to assess what is causing high or low frustration for each group. This will help you see what changes can help each group of agents reduce frustration.
To make finding insights easier, you could also create a category for each group of agents. Select At Least One of These in the category rules. Then, add a Metric for Agent Name and enter the name of an agent in that group. Do that for each agent in a group. Repeat these steps to create a separate category for each group of agents.
Classics, Inc. separated agents into four equal groups based on their percentage of frustrated interactions. They filtered the workspace to view data for each group one at a time. The group with a lower than average frustrated interactions struggled with delayed orders. However, Classics found that the first group, with very few frustrated interactions, didn't struggle with this topic. Classics looks at what the top group of agents is doing that’s leading to lower frustration levels for delayed orders. They identify behaviors and processes of the top group to help the other groups improve. This also helps lower overall frustration.
-
Click
in the top right corner of your workspace. -
Click Add Filters and select Frustration.
-
Expand the Frustration filter you just added and select Frustrated. The widgets in the workspace update to only display data for frustrated interactions.
-
Click Add Filters again and expand the Metrics drop-down. Select the Agent Name metric. Enter or select the name of an agent in the first group.
-
Repeat the last step until you have added all the agents in this group.
-
Once you're done, click
. -
Identify the top categories and review the What People Are Talking About widget. Look for common topics challenging this group of agents and causing frustration.
-
Repeat these steps for each of the four groups of agents. Identify common reasons for frustration as well as differences between each group.
Regularly monitor progress by exploring individual interactions to identify causes. These causes might include complicated processes, ineffective policies, or negative agent behaviors that cause frustration.
Your workspace will be most effective when you tie insights to business goals and strategies. It's also important to share insights with the people who have power to make change happen.