

Do you want to know what agents are saying to customers? Do you want to confirm agents are using a new sales script or verify that agents include legally required language? Follow this success guide to design a workspace![]() Named view of one or more widgets. and categories
Named view of one or more widgets. and categories![]() Data groups that Interaction Analytics (CXone) uses for parsed call transcript data. They make it easier to find trends. focused on investigating the words and phrases in interactions. Discovering phrase insights can benefit your organization in these ways:
Data groups that Interaction Analytics (CXone) uses for parsed call transcript data. They make it easier to find trends. focused on investigating the words and phrases in interactions. Discovering phrase insights can benefit your organization in these ways:
-
Reduce legal costs: You can calculate the typical annual cost of fines due to non-compliance. This workspace helps you reduce that amount.
-
Improve policy adherence: Improve the customer experience by coaching agents who aren't consistently using required processes or statements. For example, you can assess phrases used in complaint management or sales scripts. Verify agents adhere to required processes.
-
Improve agent efficiency: Ensure agents respond to objections as trained. Help them be prepared to handle frequently asked customer questions, so you can avoid long hold times.
-
Increase sales potential: Sales agents who adhere to company processes tend to perform more effectively.
The leadership at Classics, Inc. wants to track if agents are using scripted responses and required phrases. They are interested in seeing if agents are using the new sales script they updated. They also want to make sure they comply with government regulations. To address these interests, Classics uses IA to create a workspace to see if agents use required language. This helps them ensure they provide good customer service, increase sales, and avoid non-compliance fines. They are interested in discovering:
- If agents use proper greeting statements, including the recording disclaimer.
- If agents are using the new sales script.
- If agents respond appropriately to "Do Not Call" customer requests.
Create a Custom Category Folder
Interaction Analytics (CXone) uses categories that help you group and identify information most relevant to your interests. IA includes out-of-the-box (OOB) category sets to help you get started. But you can also create your own categories based on your organization's needs. For this workspace, it is most helpful to add custom categories focused on agent phrase insights.
It's easiest to add custom categories to an existing category set. OOB categories provide insights about why customers initiate contact, but you should review them to ensure they align with your organization's interests.
We recommend using the Contact Center Highlights category template with this workspace. Contact Purpose and First Contact Resolution are also useful for identifying interaction reasons that might be related to agent phrases you want to monitor. These already include helpful categories, but you can modify them as needed.
- Go to the Language Model page.
- Click more options
 in the row where you want the category.
 - Click New Category Folder.
- Enter a name for the category folder, based on what your goal is. For example, you could name it Improper Greeting or Required Recording Statement.
- Click My Workspace to return to the workspace.
If you decide that the phrases you're interested in fit into an existing category folder, you can create the category or category folder there instead. For example, you could put it in the Agent Performance Negative category folder in the Contact Center Highlights category set.
Set Up an Agent Phrase Insights Workspace
These instructions are a recommendation for how to build a workspace![]() Named view of one or more widgets.. They're meant to help you get started. You can customize workspaces in many other ways to suit your organization's needs. You can configure a dataset workspace using other widgets
Named view of one or more widgets.. They're meant to help you get started. You can customize workspaces in many other ways to suit your organization's needs. You can configure a dataset workspace using other widgets![]() Graphical representation of data that meets specified filter criteria., metrics
Graphical representation of data that meets specified filter criteria., metrics![]() Statistics you can measure to keep track of your contact center., and filters not mentioned here.
Statistics you can measure to keep track of your contact center., and filters not mentioned here.
Create the Workspace
- In Interaction Analytics (CXone), go to My Data and open the dataset you want to analyze.
- If it's not already open, click the workspaces panel
 . Then click Add Workspace.
 - Click the following widgets in order to add them to your workspace:
Overview Bar, under the Volume section.
Top Categories, under the Volume section.
Metrics, under the Volume section. Select this widget twice, so that two appear in your workspace.
What People Are Talking About, under the Sentiment section.
Interactions, under the Authors & Sources section.
Some of these widgets require more configuration after you add them to the workspace. This is so you can view specific data related to frustration. Other widgets use the default settings.
- You can edit any of the widgets to adjust their size or position.
Configure Top Categories Widget
Configure the Top Categories widget to display the category you created to monitor agent phrase usage.
- Click more options
 > Settings in the top right corner of the widget.
 - Change the widget Title to the name of the category folder you created, such as Improper Greeting.
- For Number to Show, enter 25, so the widget displays data for the maximum number of teams possible. The default is 10. You can also customize the bar color or the order in which the bars display in the widget.
- Click OK.
Configure Metrics Widgets
Configure one Metrics widget to display data by team and the other to display data by agent.
- Click more options > Settings in the top right corner of the first Metrics widget.
- Give the widget a new Title, such as Teams.
- Click the Widget Options drop-down and for Field, select Team Name.
- For Number to Show, enter a number from 1–25, the number of teams you want the widget to display data for. The default is 10.
- You can customize the bar color or the order in which the bars display in the widget. Configure each Metrics widget with a different color, so you can easily tell them apart.
- Click OK.
- Repeat these steps for the second Metrics widget, but for Field, select Agent Name. You can make the same customizations and give the widget a new Title, such as Agents.
-
To save widget configurations, click
 > Save Workbook. Your configuration now appears as an option in the Workspace panel to the left.
Optimize Categories
Use the workspace to create optimized categories![]() Data groups that Interaction Analytics (CXone) uses for parsed call transcript data. They make it easier to find trends. for the category folder you created. Create one category that includes the language agents should be using. Create a second category that excludes the same language.
Data groups that Interaction Analytics (CXone) uses for parsed call transcript data. They make it easier to find trends. for the category folder you created. Create one category that includes the language agents should be using. Create a second category that excludes the same language.
Classics, Inc. wants to see when agents aren't using the appropriate scripted language to greet customers. They want to create a category to help them find interactions where this happens. A data analyst at Classics used the following steps to create a category for Improper Greetings:
- They add a Participant filter to only look at the Agent side of interactions.
-
They apply a Keywords and Phrases filter to the workspace
 Named view of one or more widgets. for the phrases: thank you for calling, thanks for calling, and how help. They set the Proximity to 2 to also include variations of those phrases.
-
They filter the workspace to only display inbound interactions The full conversation with an agent through a channel. For example, an interaction can be a voice call, email, chat, or social media conversation..
- They apply all filters to the workspace and then save them as a category.
Note that saving a category doesn't provide the option to save it to a specific category folder. If you want a category in a specific folder, you can create a New Category Folder or move it to an existing folder.
-
To create a new folder, click more options
next to Categories and give the folder a name. -
To move a category into a folder, click more options
next to the category and click Cut.
Then, click more options next to the category folder you want it in and click Paste. Or you can click the handlebar  next to the category and drag it to where you want it.
Create Phrase Included Category
Apply filters to include the required phrase agents should be using. Then save those filter settings as rules and criteria for a new category.
-
Add a participant filter to the workspace.
-
Click Filter
 in the upper right corner of the workspace Named view of one or more widgets..
- Click Add Filters and select the Participant filter.
- Click the Participant filter just added and select Agent.
-
Click Filter
-
Filter the workspace by the language agents should be using.
-
Click Filter in the upper right corner of the workspace.
- Click Add Filters and select the Keywords and Phrases filter.
- Click the Keywords and Phrases filter just added and select Have. This excludes the phrases from the filter and displays interactions where the proper language isn't used.
- Enter the phrase agents should use, such as call is being recorded.
- In the Matching drop-down, select Approximate.
- In the Proximity drop-down, use the + and - or enter 2. This displays interactions with similar phrases that vary by up to two words. This allows the filter to include results that are similar enough to the phrases agents should use.
- Click Add.
-
Click Filter
-
Filter the workspace to only display inbound interactions.
-
Click Filter in the upper right corner of the workspace.
- Click Add Filters and select the Metrics filter.
- Select the Direction Type metric.
- Click the Direction Type filter just added and select InBound.
-
Click Filter
-
After adding all filters, click Search
 .
.
- Review interaction transcripts to see if there are any additional words and phrases to add to the filter. For example, the Classics analyst notices that an agent said "thank you for choosing Classics". This is also an acceptable greeting, so they add thank you for choosing to the Keywords and Phrases filter. If you add more than one phrase to the Keywords and Phrases filter, select Have at least one to include all the phrases you enter.
-
Save these workspace filters as a category.
-
Click Save > Save as Category. The window that pops up contains the filter criteria already appropriately positioned within the rule structure of the category.
- Enter Phrase Included for the Category Name.
- In the first rule, click Any time during interaction and change it to At the beginning of the interaction. Since greetings only happen at the beginning of interactions, it's helpful to focus on just this part. Enter 30 for the number of seconds to include as the beginning of the interaction.
- In the second rule, click Agent and change it to Agent and Client. Metrics don't have participants, so categories with Metric criteria should always include Agent and Client.
- Click Save as Category.
-
Click Save
If you want to add a category that excludes the required language, continue to the next section. If not, go to the Language Model page and click Update Data.
Create Phrase Excluded Category
Create a category that excludes the required phrase agents should be using.
-
Add a participant filter to the workspace.
-
Click Filter in the upper right corner of the workspace Named view of one or more widgets..
- Click Add Filters and select the Participant filter.
- Click the Participant filter just added and select Agent.
-
Click Filter
-
Filter the workspace by the language agents should be using.
-
Click Filter in the upper right corner of the workspace.
- Click Add Filters and select the Keywords and Phrases filter.
- Click the Keywords and Phrases filter just added and select Not have. This excludes the phrases from the filter and displays interactions where the proper language isn't used.
- Enter the phrase agents should use, such as call is being recorded.
- In the Matching drop-down, select Approximate.
- In the Proximity drop-down, use the + and - or enter 2. This displays interactions with similar phrases that vary by up to two words. This allows the filter to include results that are similar enough to the phrases agents should use.
- Click Add.
-
Click Filter
-
Filter the workspace to only display inbound interactions.
-
Click Filter in the upper right corner of the workspace Named view of one or more widgets..
- Click Add Filters and select the Metrics filter.
- Select the Direction Type metric.
- Click the Direction Type filter just added and select InBound.
-
Click Filter
-
After adding all filters, click Search .
- Review interaction transcripts to see if there are any additional words and phrases to add to the filter. For example, the Classics analyst notices that an agent said, "thank you for choosing Classics". This is also an acceptable greeting, so they add thank you for choosing to the Keywords and Phrases filter. If you add more than one phrase to the Keywords and Phrases filter, select Have at least one to include all the phrases you enter.
-
Save these workspace filters as a category.
-
Click Save > Save as Category. The window that pops up contains the filter criteria already appropriately positioned within the rule structure of the category.
- Enter Phrase Excluded for the Category Name.
- In the first rule, click Any time during interaction and change it to At the beginning of the interaction. Since greetings only happen at the beginning of interactions, it's helpful to focus on just this part. Enter 30 for the number of seconds to include as the beginning of the interaction.
- In the second rule, click Agent and change it to Agent and Client. Metrics don't have participants, so categories with Metric criteria should always include Agent and Client.
- Click Save as Category.
-
Click Save
To apply your changes, go to the Language Model page and click Update Data.
Changing the category set requires a reprocess to apply the changes. This can take several hours to complete, so you may want to wait until the end of the workday and have this run overnight. You can monitor the Reprocess Status in the bottom of the left navigation menu in Interaction Analytics (CXone).
How to Use an Agent Phrase Insights Workspace
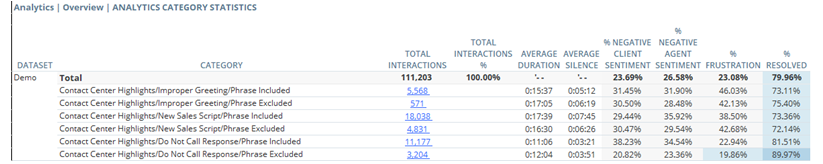
Start by determining what phrases you would like to monitor. Develop a theory about agent phrase usage and set goals for what you'd like to improve. Predict when and why you think agents use certain required language. Consider what specific processes or behaviors might be causing customers to reach out to you. Establish a baseline for your contact reasons by using the Analytics Category Statistics report. You may want to adjust category sets![]() Category groupings that help you use data for a specific purpose. Out-of-the-box category templates include Intent to Buy and Risk Aversion. or widget configurations based on what you find in this report. This workspace works best with a category set designed for your organization’s interaction reasons.
Category groupings that help you use data for a specific purpose. Out-of-the-box category templates include Intent to Buy and Risk Aversion. or widget configurations based on what you find in this report. This workspace works best with a category set designed for your organization’s interaction reasons.
Each widget in this workspace displays details to help you test your theory. Compare widgets side by side to see specific issues. Your observations help you determine what filters can identify areas for improvement. The widget data that displays in the workspace![]() Named view of one or more widgets. depends on the dataset parameters selected for the dataset.
Named view of one or more widgets. depends on the dataset parameters selected for the dataset.
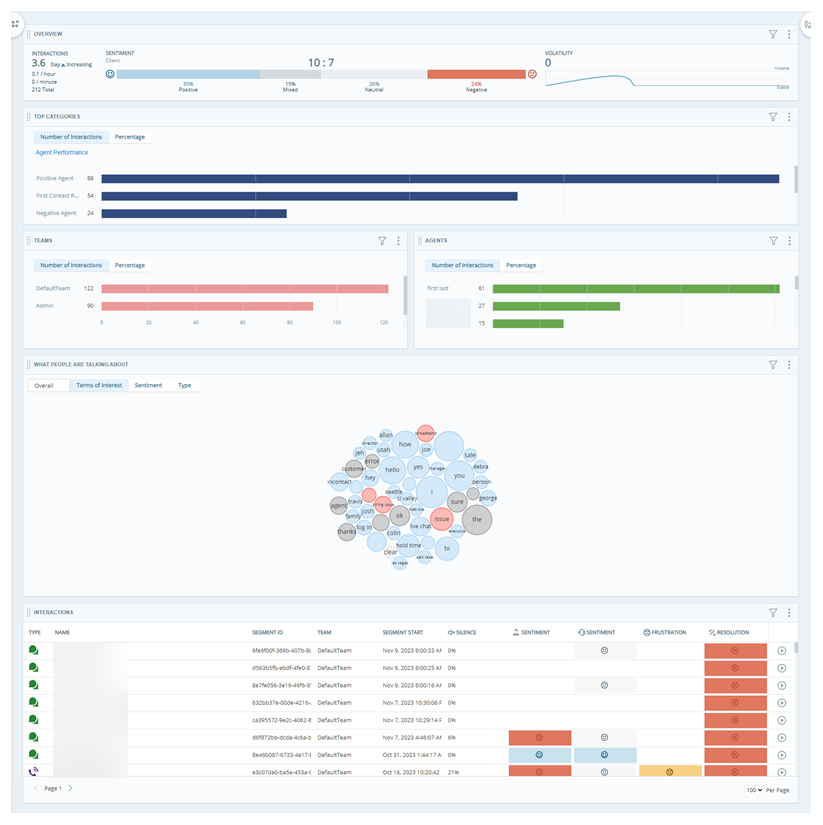
Overview Bar Widget
The Overview Bar widget provides helpful context for how many total interactions are included in the dataset. When you view data in other widgets or apply filters to the workspace, reference the Overview Bar widget to gauge the significance of that data. For example, if you see one of the categories in the Top Categories widget has 941 interaction matches, and the Overview Bar widget displays a total of 3,400 interactions in the dataset, you know that 28% of your total interactions fit into that category. This helps you determine what data is most significant and where you should focus your improvement efforts.
Top Categories Widget
The Top Categories widget helps you quickly identify the largest opportunities for improvement. It lets you review categories with the most interaction matches without needing to filter the workspace by certain categories.
-
Configure the Top Categories widget to display the Phrase Included category. Review the widget and determine the number of interactions including the phrase.
-
Next, configure the Top Categories widget to display the Phrase Excluded category. Review the widget and determine the number of interactions excluding the phrase.
Depending on what you discover you may want to filter the entire workspace by the categories you created to see how that affects the data in the other workspace widgets. This might help you review how consistent agents are in their phrase usage. You can also discover relationships between a category and things like sentiment![]() Overall mood or result of the interaction as determined by analysis of words, phrases, and context of the transcript., resolution status, or certain keywords and phrases. Try filtering the workspace by other categories as well to see if certain interaction reasons are related to phrase usage. These discoveries might also lead you to adjust existing categories or create new ones.
Overall mood or result of the interaction as determined by analysis of words, phrases, and context of the transcript., resolution status, or certain keywords and phrases. Try filtering the workspace by other categories as well to see if certain interaction reasons are related to phrase usage. These discoveries might also lead you to adjust existing categories or create new ones.
After you create or edit a category you must go to the Language Model page and click Update Data to apply the changes you've made. This triggers a reprocess for the current dataset. This can take several hours to complete. So, if you are also making changes to any other Settings, such as the company profile, complete all changes before you update. This allows you to include all updates in the same reprocess. If you make any additional changes within five minutes of clicking Update Data, they are also included in the reprocess. You can monitor the Reprocess Status in the bottom of the left navigation menu in Interaction Analytics (CXone)
Metrics Widgets
The Metrics widgets help you see which teams and agents need coaching to consistently use required language. It helps you quickly identify where to focus your attention.
-
Filter the Metrics widgets or the workspace by the Phrase Included category.
-
Review the Metrics widgets to see which teams and agents have the most interactions. Note the total number of interactions that include the required phrase. If you have more than 25 teams, you may want to use workspace filters to see data for more teams or agents.
-
Filter the Metrics widgets or the workspace by the Phrase Excluded category.
-
Review the Metrics widgets to see which teams and agents have the most interactions. Note the total number of interactions that exclude the required phrase. If you have more than 25 teams, you may want to use workspace filters to see data for more teams or agents.
-
Compare the total number of interactions that include the phrase and exclude the phrase. Reference the Overview Bar widget to see how these numbers compare to the total number of interactions in the dataset.
-
Determine which teams and agents need the most help and what the biggest opportunities for improvement are.
What you find in the Metrics widgets can help you know how to further filter the dataset. Try filtering by skill names to identify the skills where agents need additional training.
What People Are Talking About Widget
The What People Are Talking About (WPATA) widget helps you find additional issues related to required phrases. Try filtering this widget by one of the required phrase categories you created. This can help you discover relationships between required language and certain interaction reasons. It could also help you find insights about reactions to different script language.
A Classics, Inc. analyst reviews the Top Categories widget and finds that the Improper Greeting category has the most interaction matches. So, they decide to filter the entire workspace by this category. Then they look at the Metrics widgets and realize that the Kansas team now has the most interaction matches. Next, they look at the WPATA widget and notice that there are large red bubbles for the terms trouble, issue, and billing question. The analyst reviews the transcripts for the interactions using these terms to investigate how Improper Greetings and billing issues might be related.
Consider hiding or ignoring certain common words such as it, this, that, is, I, you, and so on. These words may appear in helpful phrases like I loved the service or This is disappointing. However, more specific words will help you find better insights more quickly.
Interactions Widget
The Interactions widget shows key details for recent interactions in the dataset. You can filter the dataset by the categories you created to see recent interactions that include or exclude phrases of interest. This makes it easier to review how certain metrics are related to required phrases. For example, you might look for sentiment or frustration related to interactions that exclude proper greetings.
Measure and Track Progress
A goal-focused workspace is most valuable when your insights are used to drive change. Be sure to measure and track your progress on a regular basis. This helps you see how you are improving and helps you set appropriate goals.
A Classics, Inc. analyst team used this Self-Service Opportunities workspace to identify ways they can reduce call volume. They discovered that customers often call for help with:
- Password reset issues.
- Trouble updating their user profile.
- Trouble activating their account.
Over the next several months, they implemented website self-service enhancements, IVR![]() Interactive Voice Response. Automated phone menu contacts use via voice or key inputs to obtain information, route an inbound voice call, or both. options, and refreshed agent training. After six months, they recorded a 12% drop in interactions
Interactive Voice Response. Automated phone menu contacts use via voice or key inputs to obtain information, route an inbound voice call, or both. options, and refreshed agent training. After six months, they recorded a 12% drop in interactions ![]() The full conversation with an agent through a channel. For example, an interaction can be a voice call, email, chat, or social media conversation.in the Self-Service category
The full conversation with an agent through a channel. For example, an interaction can be a voice call, email, chat, or social media conversation.in the Self-Service category![]() Data groups that Interaction Analytics (CXone) uses for parsed call transcript data. They make it easier to find trends.. At $3.50 per interaction, they saved about $8,400 a month, or $50,400 over the last six months.
Data groups that Interaction Analytics (CXone) uses for parsed call transcript data. They make it easier to find trends.. At $3.50 per interaction, they saved about $8,400 a month, or $50,400 over the last six months.
A Classics, Inc. analyst uses this agent phrase insights workspace![]() Named view of one or more widgets. to see if agents are using required language during interactions. They use the workspace to discover ways they can improve processes and agent training to hopefully avoid these issues in the future. They discover:
Named view of one or more widgets. to see if agents are using required language during interactions. They use the workspace to discover ways they can improve processes and agent training to hopefully avoid these issues in the future. They discover:
- 10% percent of agents don't use the proper greeting language.
- Interactions including the sales script had a higher positive sentiment when compared to interactions that used the old sales script.
- When agents used the appropriate script in response to "Do Not Call" requests, positive sentiment Overall mood or result of the interaction as determined by analysis of words, phrases, and context of the transcript.was higher.
As a result, Classics enhances training to focus more on the importance of following call scripts. They add role playing exercises to help agents become more comfortable with communicating all required language.
A month later, Classics runs the Category Statistics report to see their progress in these areas. The report shows that even more agents are using the sales script and proper greetings. Interaction matches in the phrase excluded categories significantly decreased from the month before.
Run the Analytics reports to view your progress. You could view data on a monthly basis or after a coaching session to track progress. Each time you run an Analytics report, you can compare that data to your baseline to measure your progress. Based on your improvements, you may also decide to use updated data to establish a new baseline to measure against. After you review insights from the workspace and Analytics reports, consider what milestones and supporting goals should come next to maintain a process of continuous improvement.
Classics, Inc. tracks monthly report data for metrics they care about. They export data from Analytics reports and note any additional data and calculations in their company records. Each month they compare the data to the previous month to see where they are improving and where they still need to make progress.
Classics uses the Agent Phrase Insights workspace and discovers that after implementing more training the percent of agents using required language significantly improved. The Classics analysts share reporting details with agents' supervisors to use as resources in coaching. This helps agents become aware of how they could make changes and develop a culture of accountability.
Identify Ways to Improve
As you investigate the inclusion and exclusion of required phrases, you'll likely find that:
-
A high number of interactions excluding the phrase across all teams and agents may indicate an issue with the script.
-
If one or more agents or teams have an unusually high number of interactions excluding the phrase, they might need targeted coaching or additional training.
If there is an issue with a script, take action and improve:
-
Review the Interactions widget for details about interactions using the script.
-
Click individual interactions to listen to recordings and review transcripts. Look for places where agents deviate from the script.
-
Once you identify the problem, collaborate with the team supervisor and other relevant leadership to update the process. Share notes and recommended edits to the script. These edits should increase clarity and make it easier for agents to follow the script.
-
Track progress using this workspace and the Analytics Category Statistics report. Review inclusion of the improved script and note whether agent usage of the phrase increases. Share these updates with interested stakeholders.
If there is no issue with the script, take action to improve agent training:
-
Review the Metrics widgets in the workspace and Analytics Category Statistics report to see which teams and agents are not using the required phrases.
-
Review interaction recording and transcripts to understand what additional training the agents need. For example, after introducing a new sales script, agents may need help understanding how to identify when a call requires certain phrases. Or the agents may be unclear on where to access or how to implement the script.
-
Collaborate with the team leader to determine an appropriate cadence to review agents' progress. Check in to ensure they understand the training and can implement it.
-
Report any progress made by agents and teams to the analytics program leaders.
-
Re-establish your baseline a month after training and monitor improvements. We recommend a minimum of four weeks to see a measurable change.
-
Update and modify existing training materials based on real interactions. Identify what’s working well and make sure it’s incorporated in training.
-
Consider what milestones and supporting goals are needed to ensure continuing progress. For example, you could set a goal to have all interactions include the phrase. You could plan to meet this goal by gradually decreasing interactions not using the phrase by 10% every month. Work with team leadership to determine achievable milestones that drive continuous improvement.
Your workspace will be most effective when you tie insights to business goals and strategies. It's also important to share insights with the people who have power to make change happen.