

This help page is for Desktop Studio. This information is also available for Studio.
You can debug snippets from the
- Check the syntax in the snippet. You can do this at any time while coding a snippet. It doesn't use the debugger tool.
- Debug the whole snippet to see variables and their values after the whole snippet has been executed.
- Set a breakpoint to stop debugging at a certain line in the code.
- Step through each line in the snippet code and see how the variable and their values change line by line.
- Use TRACE statements to output data to the
Additionally, if your code contains dynamic objects or arrays, you can see their contents and how it changes.
Check Snippet Syntax
You can have Studio check the syntax in a snippet.
- In Studio, open a script containing a Snippet action.
- Double-click on the Snippet action.
- Add Snippet code on the
-
Click the Check Syntax icon
 at the bottom of the
 If no syntax errors are found, the status field next to the Check Syntax icon displays the message Okay.
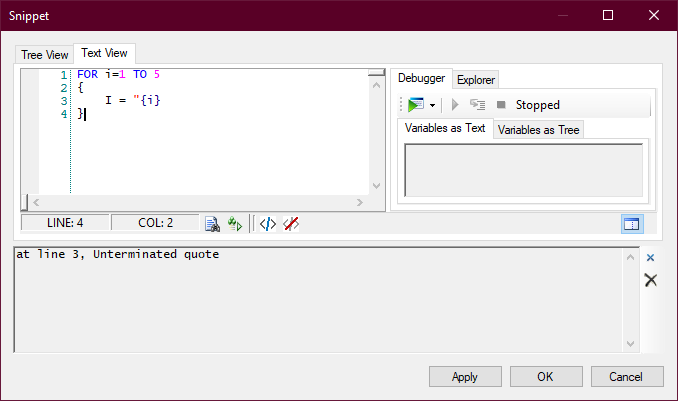
If syntax errors are found, an error message pops up describing the error. The description includes the line number where the error is located. Additionally the status field next to the Check Syntax icon displays the message Error at line [#].
- Correct any syntax issues that were found.
- You can select one or more lines in the snippet code and click the Comment out selected lines icon
 . This is helpful is you want to skip an error and check for any remaining errors.
 - You can select one or more commented-out lines in the snippet code and click the Uncomment the selected lines icon
 .
.
Use the Debugger Tool
- In Studio, open a script containing a Snippet action.
- Double-click on the Snippet action.
- Add Snippet code on the
- On the right side of the
- Click the down-arrow button on the right side of the Debug icon
 and select Start
 .
. -
If there are any syntax errors in the code, the
- Correct the errors.
- When the errors have been corrected, click the Close or Clear Trace Output icons
 to close the error pane.
 - Start the debugger again.
- View the contents of the
- You can select one or more lines in the snippet code and click the Comment out selected lines icon . This is helpful if you want to remove some code to see how the outcome of the debugging changes.
- You can select one or more lines of commented-out code and click the Uncomment the selected lines icon to add those lines back into the snippet.
Debug with a Breakpoint
You can set a breakpoint if you want debugging to stop at a specific line in the snippet code. This allows you to see the variables and values partway through the snippet without stepping through it line by line.
- In Studio, open a script containing a Snippet action.
- Double-click on the Snippet action.
- Add Snippet code on the
-
Click in the column to the left of the line numbers in the
- On the right side of the
- Click the down-arrow button on the right side of the Debug icon and select Start.
-
If there are any syntax errors in the code, the
- Correct the errors.
- When the errors have been corrected, click the Close or Clear Trace Output icons to close the error pane.
- Start the debugger again.
- View the contents of the
- If you're done with the breakpoint, click the red circle again to clear it.
- Set another breakpoint, if you need one.
- To continue debugging from the breakpoint, click the Resume icon
 .
. - To stop debugging, click the Stop Debugging
 icon.
icon.
Step Through Snippet Code
You can use the debugger tool to step through the snippet code line by line. This allows you to see how the variables and their values change as each line is executed.
- In Studio, open a script containing a Snippet action.
- Double-click on the Snippet action.
- Add Snippet code on the
- On the right side of the
- Click the down-arrow button on the right side of the Debug icon and select Start.
-
If there are any syntax errors in the code, the
- Correct the errors.
- When the errors have been corrected, click the Close or Clear Trace Output icons to close the error pane.
- Start the debugger again.
- View the contents of the
- Click the Step icon
 to move to the next line in the snippet.
 - Repeat steps the preceding two steps for each line in the snippet.
- If you want to skip the remaining lines of code, click the Resume icon . The
- To stop debugging, click the Stop Debugging icon, then repeat this process starting from step 3.
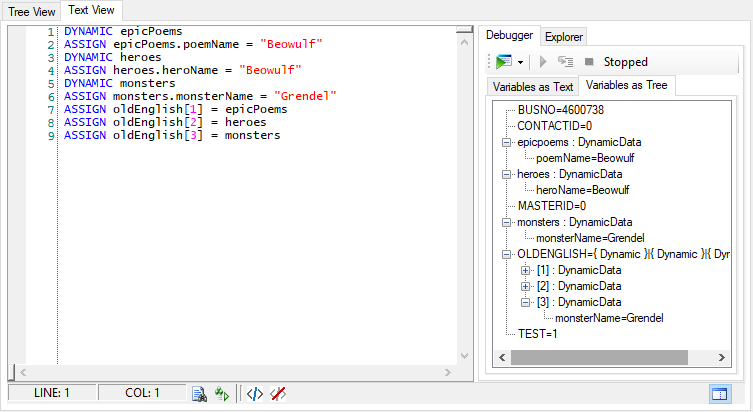
View Contents of Dynamic Objects and Arrays
You can view the contents of dynamic objects in the
- In Studio, double-click on a
- Add snippet code, if necessary.
- On the
- On the and select Step Into . If you don't want to step through the code line by line, click the Start Debugging icon.
- Click the Step icon and observe the contents on the
- When you have stepped through all lines of code or if you clicked Start Debugging, the
-
You can click the + icon next to any string arrays or dynamic objects in the code to expand them. If the content is another array or object, you can continue to expand the tree to see what each entity contains.
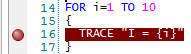
Debug using TRACE
The
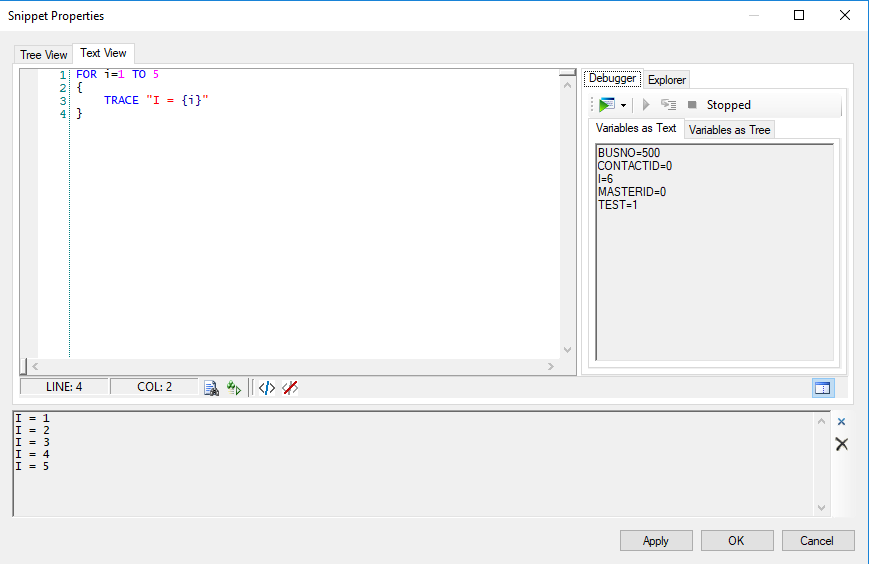
The
The syntax is: TRACE "<text>"
Text within the double quotes is output to the
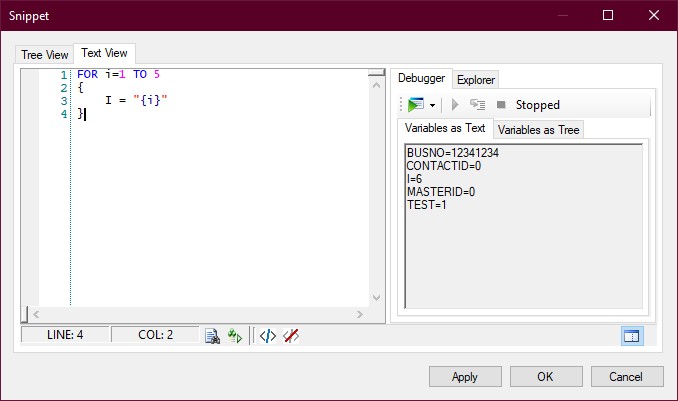
You can use variable substitution between the double-quotes to print the value of variables. For example:
FOR i=1 TO 5
{
   TRACE "I = {i}"
}
The output from this example is:
I = 1
I = 2
I = 3
I = 4
I = 5
Use the Test System Variable
The variable is a system variable reserved for use in debugging snippets. It allows you to set the value of variables that are used in the snippet and would already be populated by the script before it hits the action.
When you use in a snippet, it must be used as part of an statement and set to 1. The code between the curly brackets only executes when you run the snippet debugger because the variable only equals 1 when the debugger runs. When the script runs for a contact![]() The person interacting with an agent, IVR, or bot in your contact center., has the value of 0, so the code between the curly brackets in the statement is ignored.
The person interacting with an agent, IVR, or bot in your contact center., has the value of 0, so the code between the curly brackets in the statement is ignored.
For example:
In this example, the statement within the statement sets the initial condition of the variable. In a live script, this value would be set elsewhere in the script and the value set in the statement would be ignored. The reason you need it in debugging the snippet is that the full script isn't running to set that value.
- In NiCE CXone, click the app selector
 and select Omnichannel Routing > Studio
  .
. - On the Scripts page, locate and double-click to open the script you want to work with. The script opens in a new tab.
-
Open a action or add a new one to the canvas.
-
Click the Text View tab.
-
At the top of the window, add the following code:
-
In place of , insert whatever code or statements you need to set the initial conditions required for the snippet to run, such as setting initial variable values that your snippet code requires. For example:
-
Add the snippet code that you want to test. For example:
-
To test the code, click the bug
 to open the debugger.
 -
Click Apply to save the snippet, then save your script.