Required permissions: Call Quality Explorer View
The Call Quality Explorer report gives you insights into the quality of voice interactions in your contact center. You can analyze up to 20 interactions in a single report.
You can add NiCE CXone Voice Diagnostics to Call Quality Explorer to provide even more data. This requires special licensing. If you are a NiCE CXone partner, you can use one license to support multiple business units![]() High-level organizational grouping used to manage technical support, billing, and global settings for your NiCE CXone system..
High-level organizational grouping used to manage technical support, billing, and global settings for your NiCE CXone system..
Your account representative must enable Call Quality Explorer (and NiCE CXone Voice Diagnostics if you use it). You can view the Voice Diagnostics configuration fields in your
Use the Call Quality Explorer Report
- Click the app selector
 and select Reporting.
 -
Go to Prebuilt Reports > Call Quality Explorer.
-
Enter the Contact ID(s) associated with the interactions you want to analyze, separated by spaces or commas.
-
Click Search.
 Learn more about fields shown for each interaction
Field
Details
DNIS
For inbound calls, the number the contact dialed to reach your contact center. For outbound calls, the number the agent dialed.
ANI
Caller ID for the contact.
Business Unit
business unit
High-level organizational grouping used to manage technical support, billing, and global settings for your NiCE CXone system. number and name for your contact center. NiCE CXone partners who manage multiple customers may see more than one listing here.Traffic Type
Type of call. This list shows each type and its associated ID:
- -1: UnknownIncontactCallType
- 0: AgentLegDefault
- 1: SytelDialer
- 2: DefaultOutbound
- 3: BlindXfer
- 4: ReskillOutbound
- 5: FaxOutbound
- 6: TestTraffic
- 7: VerintCallRecorder
- 8: OutboundToTTS
- 9: OutboundToConference
- 10: OutboundToASR
- 11: OutboundSMS
- 12: NaturalCallingDialer
- 14: Range1777 (Hosted VOIP)
- 15: DiscoveryRecorder
- 100: InboundPOC
- 101: ReskillInbound
- 102: InboundToAgent
- 103: InboundToReAgent
- 104: InboundToTakeOver
- 105: InboundSMS
Line Type Type of line. This list shows each line type and its associated ID:
- -1: Unknown_Line_Type
- 0: PSTN_Landline
- 1: PSTN_Wireless
- 2: Toll_Free
- 3: Line_Info_Blocked
- 4: inContact_ASX_Hosted_VOIP
- 5: inContact_Broadsoft_Hosted_VOIP
- 6: inContact_Dedicated_Outbound
- 7: Cloud_Connect_Inbound
- 8: inCloud
- 9: inContact_Dedicated_International_Inbound
- 10: inContact_Internal_System_Leg
Inbound MoS The Mean Opinion Score coming from outside to a NiCE CXone device. This score ranks the quality in a voice session on an industry-standard scale. -
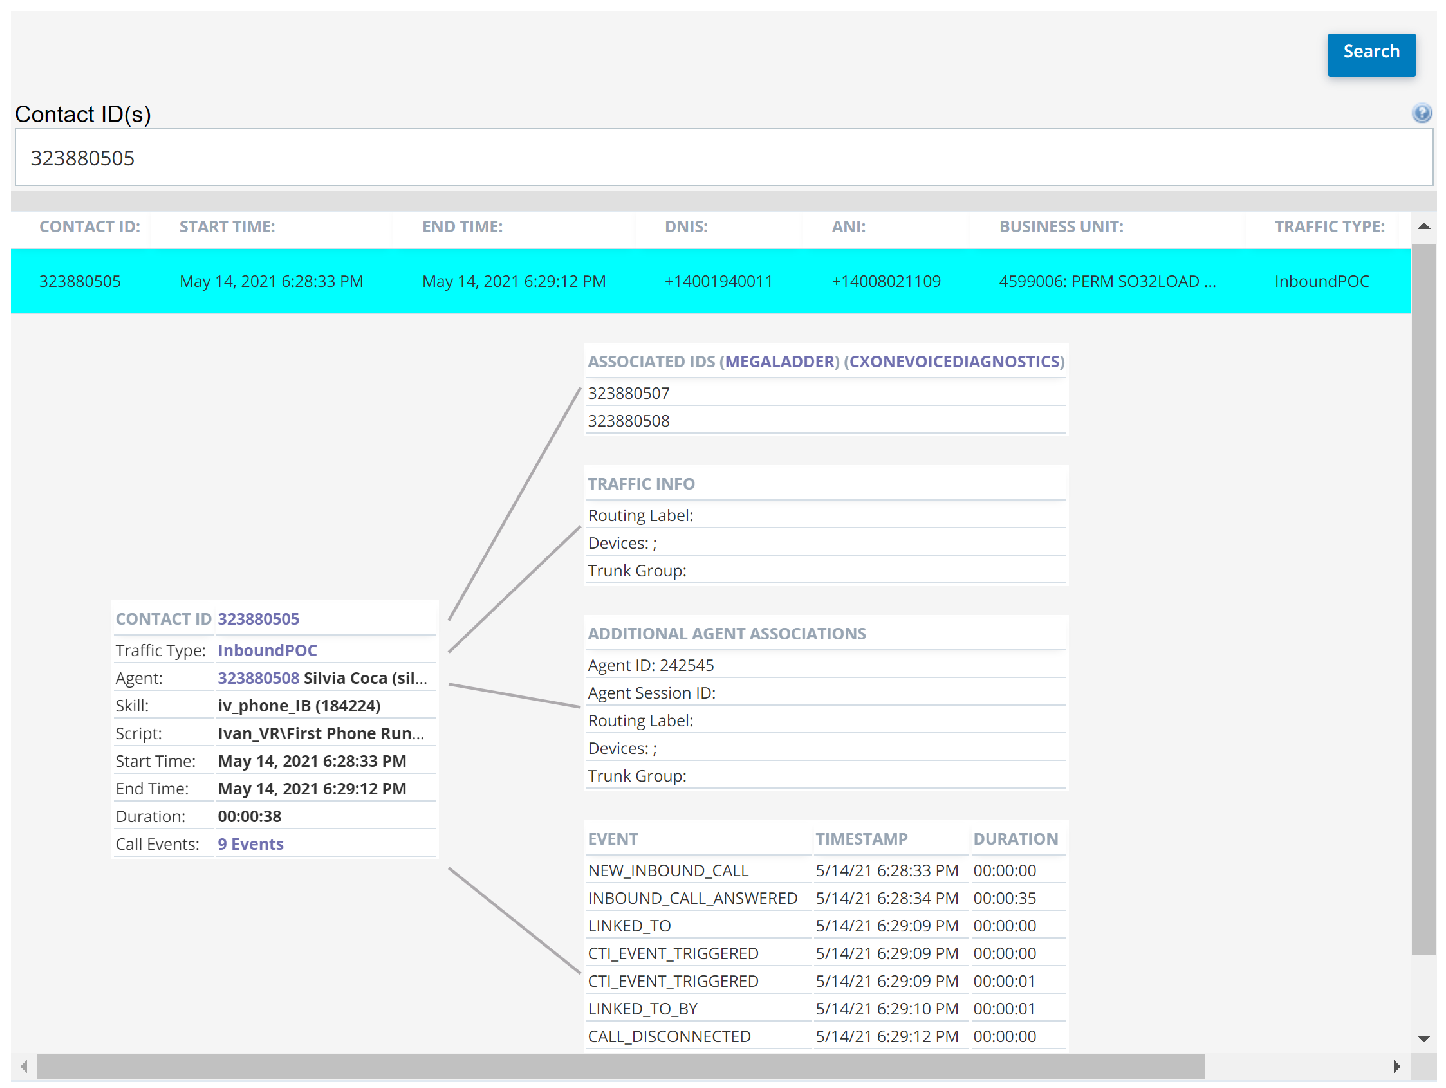
Click the row of the interaction you want to view. The specific interaction table appears.
Learn more about the specific interaction table
When you click on an interaction, this table appears on the left, as shown in the image above. It includes some fields from the drop-down in the preceding step, including Contact ID, Start Time, End Time, and Traffic Type. It also includes these additional details:
Field
Details
Agent
The unique ID and name of the agent who handled the interaction.
Skill The skill associated with the point of contact The entry point that an inbound contact uses to initiate an interaction, such as a phone number or email address. for the interaction.Script The script associated with the point of contact for the interaction. Duration The duration of the interaction in HH:MM:SS format. Call Events The number of events that occurred during the interaction. -
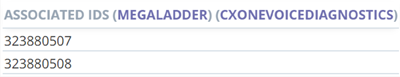
Click the value in Contact ID for a table of additional information about the interaction. You can click MegaLadder or NiCE CXone Voice Diagnostics to view quality of service data in a new browser tab. You may also see Contact IDs for interactions related to this one. Click one of these Contact IDs to add it to the Call Quality Explorer report and view its details.
-
Click the value in Traffic Type to view a table with more information about the call traffic and routing.
Learn more about fields in the Traffic Info table
Field
Details
Routing Label Route label specified by the Devices
Device type that originated the interaction.
Trunk Group Extension used to send the call into your environment. -
Click the value in Agent ID to view a table of additional agent associations.
Learn more about fields in the Agent Associations table
Field
Details
Agent ID
Unique ID assigned to the agent.
Agent Session ID
Unique ID assigned to the agent's login session during which the interaction occurred.
Routing Label Route label specified by the Devices
Device type that originated the interaction.
Trunk Group Extension used to send the call into your environment. -
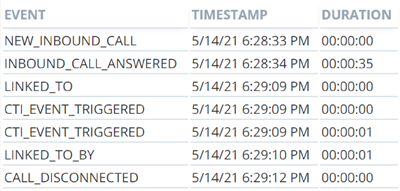
Click the value in Call Events to view a table of events that happened during the interaction.
Learn more about fields in the Call Events table
The basic table shows the event, when in the interaction it happened, and how long it lasted. If you hover over an event with your cursor, you can see additional details as explained in this table.
Field
Details
CallHistoryEventId Primary key and identity. TimeStamp
UTC time of the event.
CallHistoryEventTypeId ID associated with the call history event type of the interaction. See the next section. CallHistoryEventType Type of event. This list contains each call history event type and its associated ID:
- -1: UNDEFINED_EVENT
Pre-connect events
- 0: NEW_INBOUND_CALL
- 1: INBOUND_CALL_REJECTED
- 2: INBOUND_CALL_DISCONNECTED_BEFORE_ANSWERED
- 3: INBOUND_CALL_ANSWERED
- 4: OUTBOUND_CALL_PLACED
- 5: OUTBOUND_CALL_CANCELED
- 6: OUTBOUND_CALL_FAILED
- 7: OUTBOUND_CALL_CONNECTED
Post-connect events
- 8: CALL_DISCONNECTED
- 9: CALL RETRIEVED BY MEDIASERVER
- 10: REMOTE_GATEWAY_CHANGED
- 11: MISSING_RTP_PACKETS_DETECTED
- 12: CALL_SWITCHED_TO_FAX_MODE
Context events
- 13: LINKED_TO
- 14: LINKED_TO_BY
- 15: UNLINKED_FROM
- 16: UNLINKED_FROM_BY
- 17: RETRIEVE_FAILED
MediaServer Name of the media server processing the call. CallHandle Call handle of the interaction on the media server. If the call hasn't been assigned a handle yet, there is no value. CauseCode Cause code for the end or failure of a connection. If the event is not an end event, there is no value. ContactId Unique ID assigned to the interaction. PeerContactId Unique ID assigned to a peer call connected to the call. It's populated on the link and unlink events. For all other events, there is no value. ContextId ID indicating the conversation of a call and all legs connected to the call. Bus_no ID of the ContactEndReasonId ID associated with the contact end reason of the interaction. ContactEndReason Reason the interaction ended.