

NiCE CXone Performance Analytics for Salesforce Einstein (PASE) allows you to analyze data on your agents and their performance. With an incremental sync, Performance Analytics for Salesforce Einstein (PASE) allows you to add new data to your existing data so that you can view analytics for any period of time. You can also view predictions and insights into a specific set of data to see how you can improve current metrics. Once you create a dataset, you can use different tools to view the data that Performance Analytics for Salesforce Einstein (PASE) has analyzed.
Create NiCE CXone Data Applications
NiCE CXone has several applications you can create to view data from, including First Contact Resolution (Case Analysis), Sales Productivity, and Agent Occupancy Efficiency. Each one has a different set of features, inputs taken from NiCE CXone data, and Salesforce objects used to create the application. You can create these as needed for your organization. Once you have created multiple apps based on the same template, you will be able to link these apps to the home screen of Performance Analytics for Salesforce Einstein (PASE).
- In the Performance Analytics for Salesforce Einstein (PASE) application, under Expert Mode, click Analytics Studio.
- On the left, under Browse, click All Items > Create > App.
-
Click Create App from Template and then:
- To create an application for first call resolution, click First Contact Resolution (Case Analysis).
- To create an application for sales productivity, click Sales Productivity.
- To create an application for agent productivity, click Agent Occupancy Efficiency.
- To create an application for lead conversion analysis, click Lead Conversion Analysis.
- To create an application for concurrent contact handling details and efficiency, click Omnichannel Effectiveness.
- To finish, click Continue > Continue.
- Select which base application to use from the drop-down and then click Looks good, next.
-
Select the task object that is linked to your NiCE CXone contact ID from the drop-down. If you are using the Digital Contact Handling Details template, you must select four task objects.
-
Click Looks good, next.
- Enter the same name as the template you selected and then click Create.
You can check on the status of your app creation in the Data Manager. Data Manager can be found in the Setup menu. Once the app has been created, you will receive an email.
Create a Dataset
You can run an analysis on a predefined set of data to receive quick insights into a variety of metrics.
- In Salesforce, click the drop-down arrow next to your most recent tab.
- Click Analytics for Salesforce Einstein.
- Under Expert Mode, click Configuration.
- Click the drop-down arrow for the predefined analysis you want to run.
-
Click Run Now.
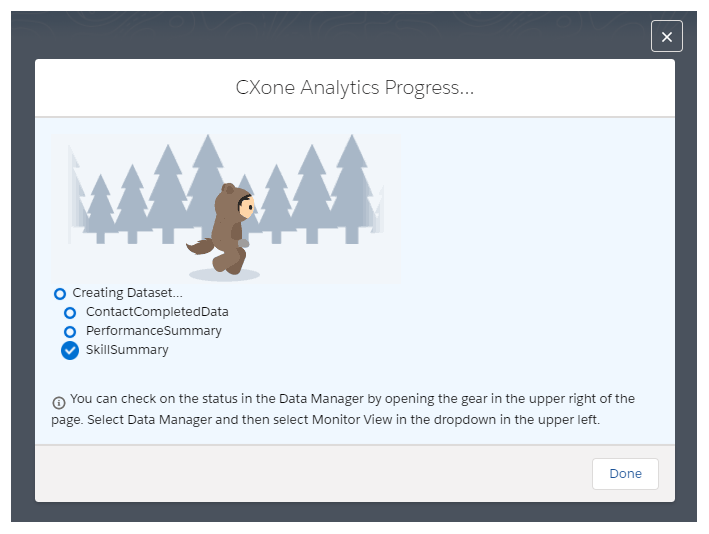
The progress can be seen in Analytics Studio using the Data Manager.
- Click Done.
Schedule Dataset Creation
You can schedule an analysis on a predefined set of data to receive regular insights into a variety of metrics.
- In Salesforce, click the drop-down arrow next to your most recent tab.
-
Select Analytics for Salesforce Einstein .
- Under Expert Mode, click Configuration.
- Click the drop-down arrow for the predefined analysis you want to run.
- Select Data Sync.
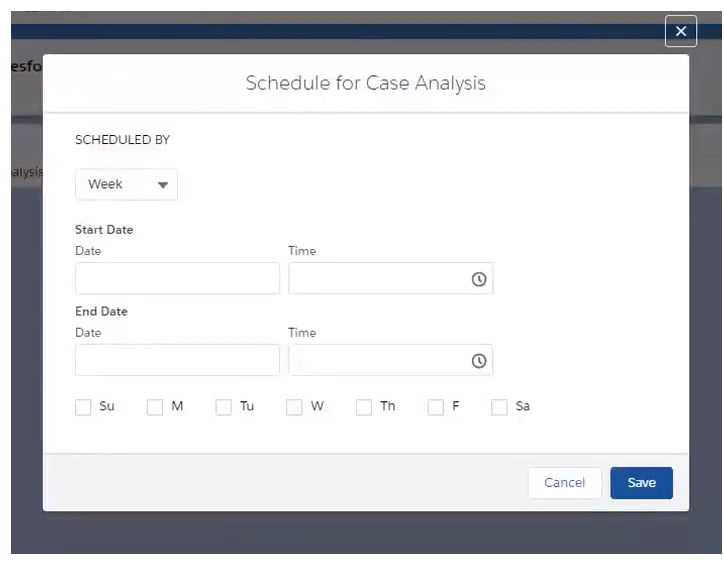
- Select the frequency with which you want the analysis to run.
- Click Save.
To unschedule, follow the same steps as above but select Unschedule instead.
View a Dashboard
- In Salesforce, click the drop-down arrow next to your most recent tab.
-
Select Analytics for Salesforce Einstein.
- Under Expert Mode, click Analytics Studio.
- On the left, under Browse, click All Items.
- Select Dashboards under All Items.
- Select the dashboard you want to view.
-
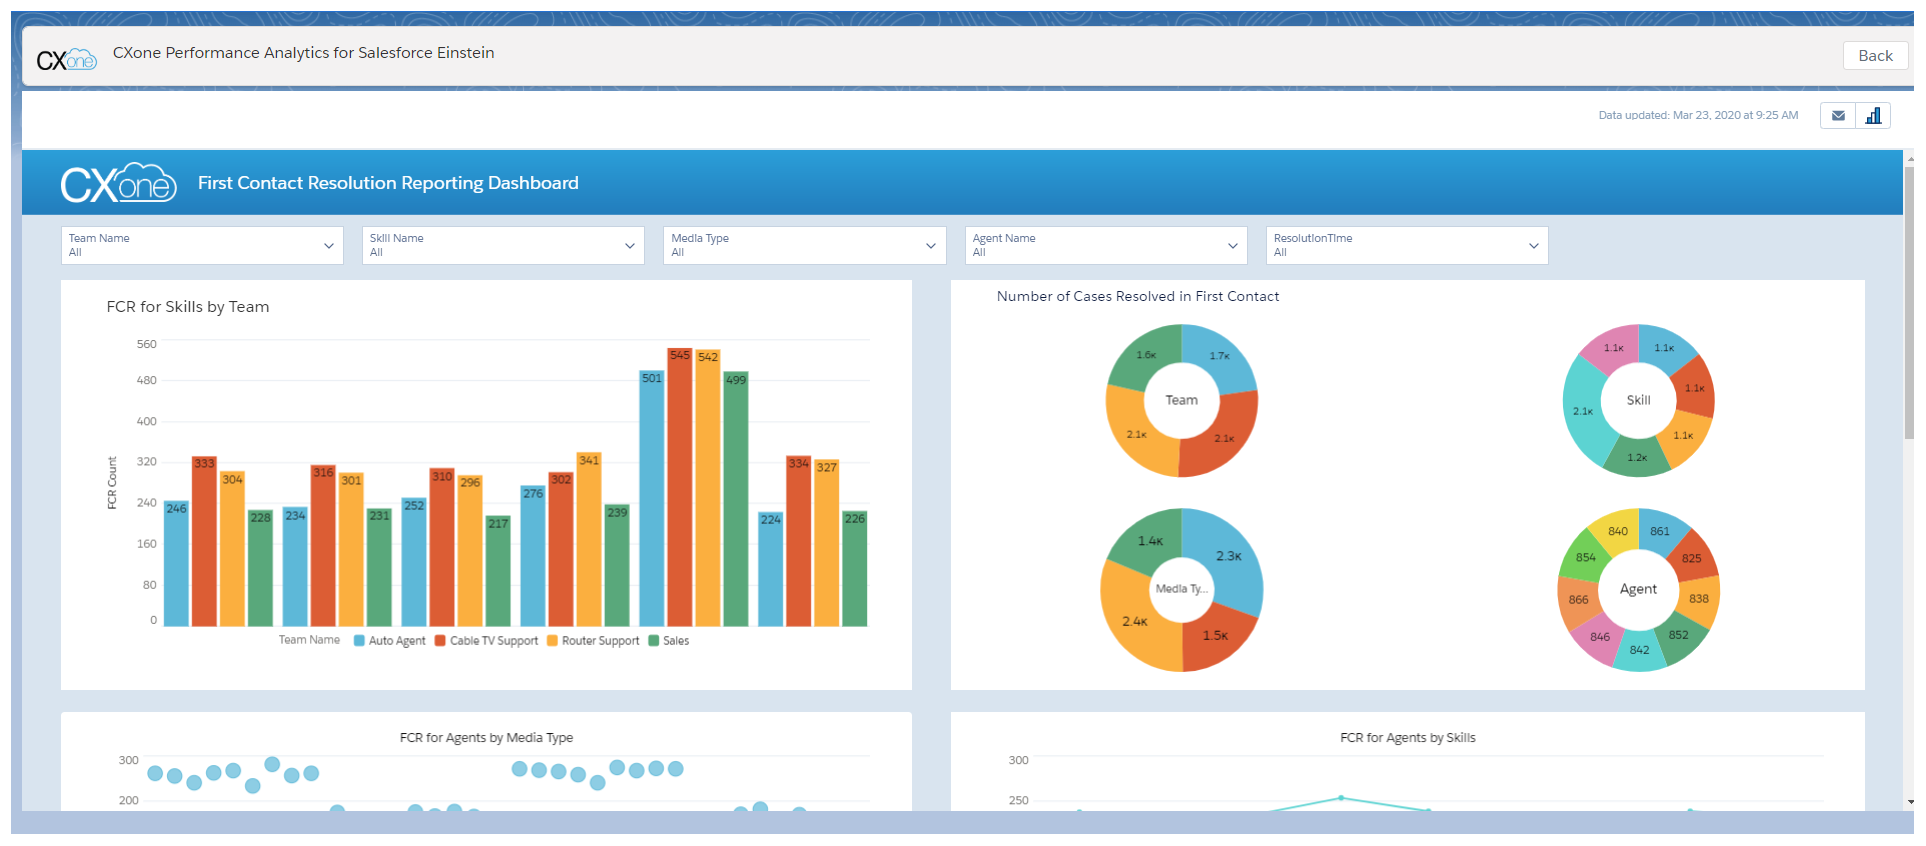
Filter the data using the drop-downs to narrow your metrics.
 Learn more about fields in this step
Field
Details
Team Name Includes or excludes interactions from the dashboard based on the name of the team.
Media Type
Includes or excludes interactions from the dashboard based on the media type.
Skill Name Includes or excludes interactions from the dashboard based on the skill name. Agent Name Includes or excludes interactions from the dashboard based on the agent name. Direction Includes or excludes interactions from the dashboard based on whether the interaction was Inbound or Outbound. Date Includes or excludes interactions from the dashboard based on the date range you select. You can select one of the existing options, or create a custom date range. When you create a custom range, you can determine whether it is Absolute or Relative:
-
Absolute - to specify a fixed date range.
-
Relative - to specify a relative date range. This incremental data updates on your dashboard every 15 minutes.
In the Operator drop-down, you can specify how you want the data to be included:
-
Equals - For data to appear in the dashboard, its value for the specified field must be equal to the specified value.
-
Does Not Contain- For data to appear in the dashboard, its value for the specified field must not be contained in the specified value.
-
Contains - For data to appear in the dashboard, its value for the specified field must be contained in the specified value.
-
You can select a metric on the dashboard to view more detailed information. The dashboard changes based on which metric you decide to drill down on.
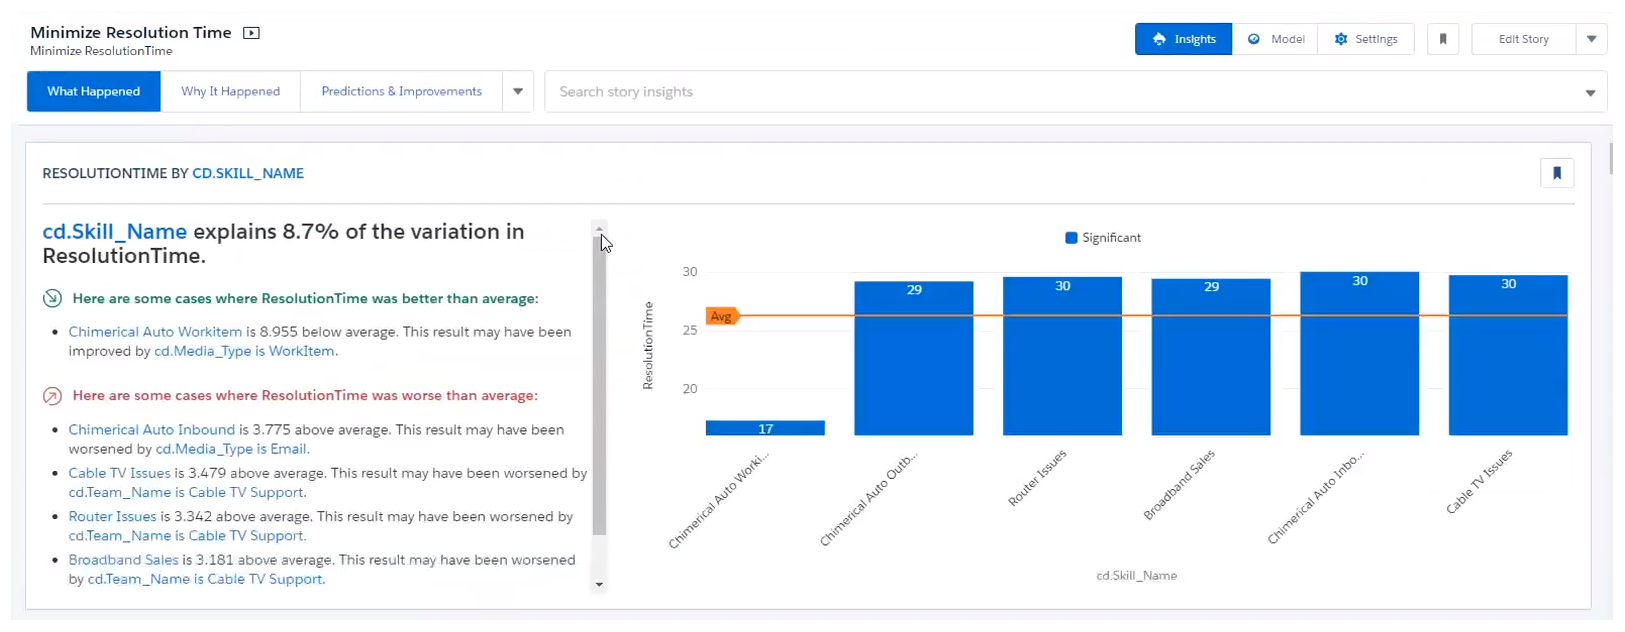
View a Story
You can view details on your agents' metrics by using stories to explore a primary agent metric.
- In Salesforce, click the drop-down arrow next to your most recent tab.
-
Select Analytics for Salesforce Einstein.
- Under Expert Mode, click Analytics Studio.
- On the left, under Browse, click All Items.
- Select Stories under All Items.
- Select the story you want to view.
- Use the What Happened, Why It Happened, and What Could Happen tabs to drill down on the data.