Metric Widgets
NICE Uptivity Performance Management offers a wide variety of content items that can be used to customize your dashboards. You can move, resize, rename, and edit widgets to create a custom dashboard appearance.
For more information, see Managing Dashboard Content Overview.
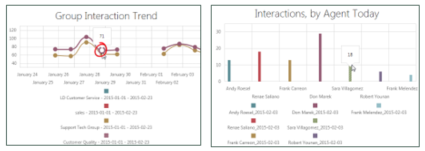
Metric widgets capture data from KPIs or metrics and present it in a variety of ways. You can use these widgets for a single value, or compare multiple values for two different metrics in a chart. Measures used in metrics are tagged with descriptive keywords (tags) in the system so you can find them. For more information, see Data Attributes of Measures and Metrics.
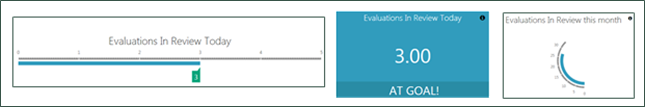
Single data-point widgets present a metric as a single number (such as a score, duration, percentage, number of minutes, and so forth), at a specific (or relative) point in time, for a specific group, agent, or other key.
Multiple data-point widgets are useful for plotting multiple numbers in a chart, either to compare many values for one metric (for example, over a period of time) or to compare values for two different metrics (for example, the same data point for different agents). You can optionally display a line or bar chart with the widget (the metrics must share the same keys).