Performance Management analyzes raw data to give you insights into your organization over a period of time. The insights can be on the agent or group level, or about the organization as a whole. The period of time for each insight varies. It can be as short as 15 minutes or as long as a year.
The raw data Performance Management analyzes come from data collectors. Data collectors take in data from your licensed NICE Uptivity components, as well as contact center ACD![]() Acronym for Automatic Call Distributor - A device used to manage and distribute incoming calls to a specific group of terminals. systems and other telephony devices. Data collectors are available for integrating any data source, including:
Acronym for Automatic Call Distributor - A device used to manage and distribute incoming calls to a specific group of terminals. systems and other telephony devices. Data collectors are available for integrating any data source, including:
- Contact center systems such as ACDs from Avaya
 One of the many integrations available with Uptivity. or Cisco One of the many integrations available with Uptivity..
 - PBX An acronym for Private Branch Exchange. A telephone switching device owned by a private company that serves a particular business or office. and radio systems.
- CAD, dispatch console, and protocol management systems.
- Business applications including CRM Acronym for Customer Relationship Management - designed to ensure the agent has all necessary aspects of the customer's information., ERP, Helpdesk, HR, and customer-developed systems.
- Workforce management systems.
- Customer survey systems.
Metrics and Measures
Performance Management data analysis uses measures and metrics to generate analytic information you can use.
- Measure—A measure is a piece of information related to the performance of agents, groups, or your organization. They can be things like average talk time, average QA score, number of calls taken, and so on.
- Metric—A metric is a calculation performed using a measure to give you analytic information. Metrics require keys, which define the context of the calculation. Keys specify the time period over which the calculation is made (when). They also define whether you want the calculation limited to the agent, group, or organization level (what).
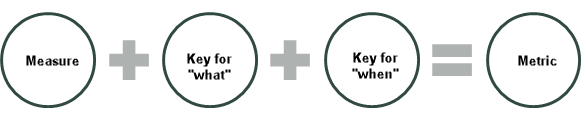
For example, the metric Average Talk Time for the Customer Service Team Today uses this information:
- Measure: Average Talk Time
- Key (what): Customer Service Team
- Key (when): Today
Another metric, Average Talk Time for Agent, Week, uses the same measure but has different keys:
- Measure: Average Talk Time
- Key (what): Agent
- Key (when): Week
Multiple Data-Point Metrics
You can combine metrics in multiple data-point metric widgets, metric views, and scorecards as long as the metrics share the same keys. For example, the keys for the "Average Evaluation Score by Agent, Month" metric are "Agent" and "Month." You can combine this metric with other "Agent, Month" metrics in a view or scorecard.
Available Measures and Metrics
The exact measures and metrics available in your system depend on the NICE Uptivity components you have. If you have integrated Uptivity with additional data sources, those data sources will add more measures and metrics to your system.
In addition to the default system-generated measures and metrics, you can create custom metrics and measures. This allows you to tailor the performance management data analysis to your organization's needs.
You can view the metrics and measures in your system by running Performance Management administration reports. Some of the reports you can run are described in this table. Your system may have additional reports available.
|
Report |
location |
|---|---|
| Measures List | Performance Management > Reports > Report Library > Performance Administration Report Area |
| Metrics List | Performance Management > Reports > Report Library > Performance Administration Report Area |
| Cisco TAPI Metrics | Performance Management > Reporting > Measure List Report and select Cisco TAPIas the Resource Type |
| QM Metrics | Performance Management > Reporting > Measure List Report and select QMas the Resource Type |
| Speech Analytics Metrics | Performance Management > Reporting > Measure List Report and select Speech Analytics as the Resource Type |
Metric Views
Metric Views enable you to analyze and compare data from a collection of metrics![]() Calculates a measure for the various intervals of time and various roll-up combinations. The formula to create a metric is: a measure plus the keys for “what” and “when.”. They're useful for exploring a collection of related KPIs
Calculates a measure for the various intervals of time and various roll-up combinations. The formula to create a metric is: a measure plus the keys for “what” and “when.”. They're useful for exploring a collection of related KPIs![]() An acronym for Key Performance Indicator - a measurable value that demonstrates how effectively a company is achieving key business objectives.. The following considerations apply to metric views:
An acronym for Key Performance Indicator - a measurable value that demonstrates how effectively a company is achieving key business objectives.. The following considerations apply to metric views:
- You can pick your own selection of metrics from any available data sources.
- Raw data is presented in a grid for contrast and comparison of values over a period of time.
- You can create metric views for different levels, such as agent, group, or company.
- Metric views include no calculated scores and no weighting of metrics.
- You can export metric views to different formats.
- You can broadcast and share scorecards with agents and groups through a published dashboard.
NICE Uptivity Performance Management includes some metric views out of the box, but you will probably want to create your own custom views. When you open a metric view, you have a flexible set of data analysis tools to explore the data in 3 different grids. You can switch between the different grids without losing changes.
Scorecard Views
A metric view generated by a scorecard includes the scorecard metrics, the weighted score for each metric on the scorecard, and the overall weighted score metric. If a metric has multiple versions, the view contains all metrics from all scorecard versions. Scorecard views are read-only. For more information, see Balanced Scorecards.
Grid Views
When you open a metric view, you have a flexible set of data analysis tools to explore the data in 3 different grids. You can switch between the different grids without losing changes.
-
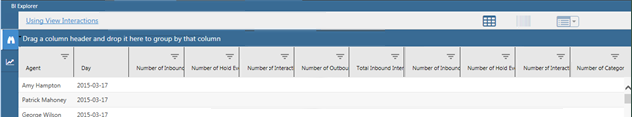
Search Grid View—The Search Grid is the default view. It's a simple table and does not require additional configuration.
-
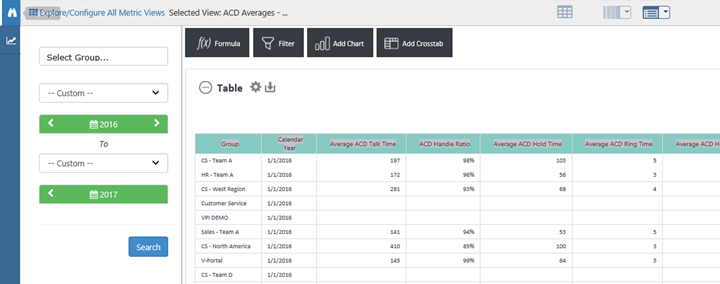
Analysis Grid View—The Analysis Grid presents the view metrics in a table format that you can sort, order, and filter. This grid is similar to a spreadsheet and useful for aggregating data in different ways for further analysis. With this view, you can:
- Rearrange the columns by drag-and-dropping.
- Export the grid to Excel, PDF, or CSV formats.
- Save the layouts for later use (click the drop-down indicator next to the Analysis Grid icon and click Save).
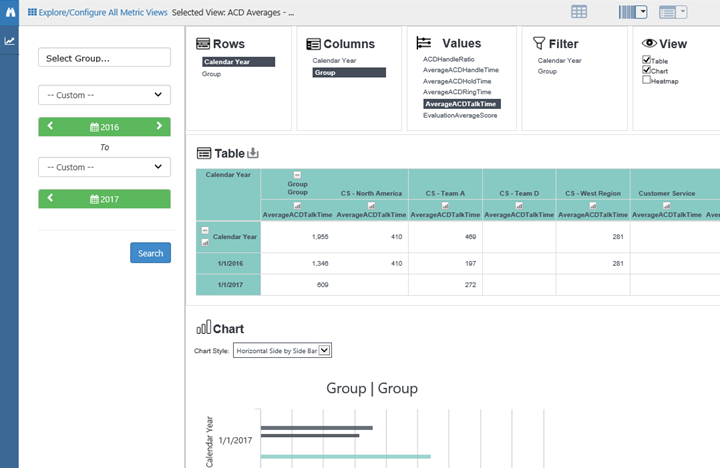
-
Dimension Grid View—The Dimension Grid provides additional ways to organize data and present it in graphical formats, such as a chart or heatmap. You can export Dimension Grids to Excel format.