Metric Views enable you to analyze and compare data from a collection of metrics, and are useful for exploring a collection of related KPIs![]() An acronym for Key Performance Indicator - a measurable value that demonstrates how effectively a company is achieving key business objectives.. NICE Uptivity Performance Management includes some metric views out of the box, but you will probably want to create your own custom views. Views generated by a scorecard are read-only, but you can open and edit any metric views created by a user.
An acronym for Key Performance Indicator - a measurable value that demonstrates how effectively a company is achieving key business objectives.. NICE Uptivity Performance Management includes some metric views out of the box, but you will probably want to create your own custom views. Views generated by a scorecard are read-only, but you can open and edit any metric views created by a user.
After creating a metric view, you can view it in several Grid Views, add it (including scorecard views) to any dashboard using the Metric View Widget, or both.
Create a Custom Metric View
- Navigate to Performance Management > BI Explorer and click the Explorer icon in the left panel (indicated by the binoculars icon).
- Click the + icon next to the search bar to launch the View Designer.
- Select a metric
 Calculates a measure for the various intervals of time and various roll-up combinations. The formula to create a metric is: a measure plus the keys for “what” and “when.”. Once you select the first metric, the list refreshes with metrics that have the same (or compatible) keys Keys provide the "what" and "when" of metrics.. You can specify Measures to narrow down the Metric results; use the Hint button if you're not sure. When you have finished selecting metrics, click Next.
 - Enter a View Name and Description. If the field is present and you want to, select an Objective from the drop-down list. When your organization has defined company-level objectives, you can tie them to metrics on scorecards and metric views.
- Click Save.
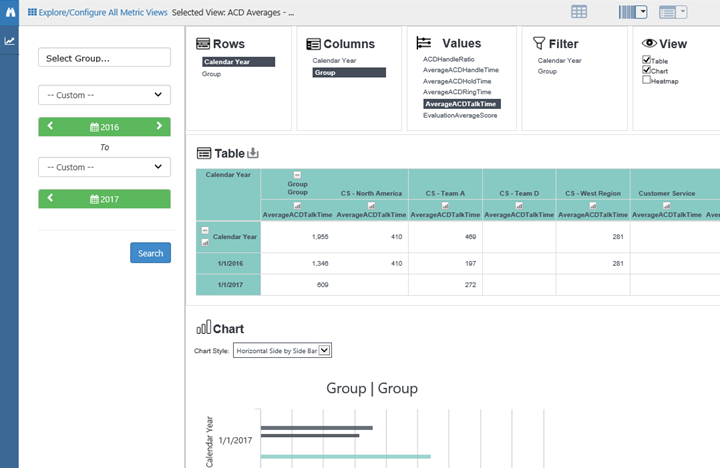
Configure a Dimension Grid View
The Dimension Grid provides additional ways to organize data and present it in graphical formats, such as a chart or heatmap. You can export Dimension Grids to Excel format.
- Select a Metric View.
- Click the Dimension Grid icon (indicated by a barcode icon).
- Click items in the Rows, Columns, Values, and Filters lists to configure the dimensions, metrics Calculates a measure for the various intervals of time and various roll-up combinations. The formula to create a metric is: a measure plus the keys for “what” and “when.” used, and grid display. As you make your selections, the grid appears in the area below.
- In the View list, you can select Chart, Heatmap, or both to add these graphical elements to the grid display.
- Click the Explorer icon (indicated by a pair of binoculars) in the left panel to open the left panel of settings. Configure the time period for the grid by selecting a pre-determined period from the drop-down list or by clicking the date selectors to choose a custom date range.
- You can save the grid for future use. To do this:
- Click the drop-down indicator next to the Dimension Grid icon and select Save this grid.
- Enter a Grid Name and a Description.
- Click Save.


