Tools for Data Analysis and Discovery
You can define company-level objectives and tie them to scorecards. By setting goals on metrics and enabling trend, you can track different aspects of KPI performance through dashboards, tickers, metric views, and balanced scorecards.
Performance Tab
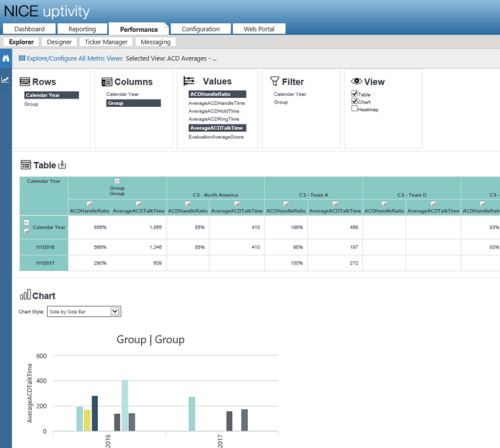
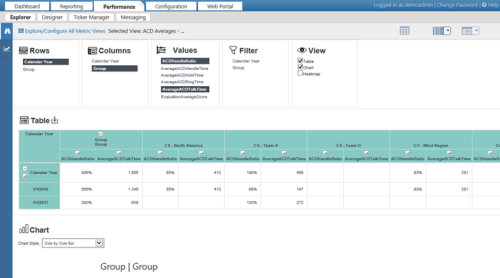
The Performance Tab features data discovery tools that you can use for further analysis at multiple levels. To compare collections of KPIs on multiple levels (by agent, group, or company), you use Metric Views in the Performance Tab.

Analysis and Dimension Grids
The Analysis and Dimension Grids are useful for organizing and manipulating data, presenting it in graphical formats, and exporting it for use outside the NICE Uptivity Performance Management system.

Balanced Scorecards
Instead of muddling through confusing calculations or relying on your stakeholders to interpret spreadsheets and draw their own conclusions from a list of metrics, you can use Balanced Scorecards to tell the “performance story” for you. Balanced scorecards combine your most important KPIs into a single performance indicator called a weighted score metric that lets everybody know how they are performing.
