Designing Dashboards Overview
NICE Uptivity Performance Management Dashboards make it easy to broadcast and share data and information in visually-rich and impactful ways across your contact center.
For more information, see Dashboards Overview.
Dashboards offer a way to deliver information and broadcast data to your groups. Using a variety of widgets (charts, lists, and gauges), lists, and reports, you can design a dashboard for any person or group to support any objective or goal.
- Agents know exactly where they stand (and how they are doing compared to the team) with their KPIs for call stats in front of them.
- Evaluators can stay on top of their evaluations by phase, task list, average score (this month vs. last), and number of auto-fails this month.
- Supervisors can use dashboards to monitor performance KPIs across their group.
- Executives value dashboards that provide a view of performance across your entire customer contact.
- Administrators can use dashboards to find and fix issues fast using user administration and troubleshooting reports.
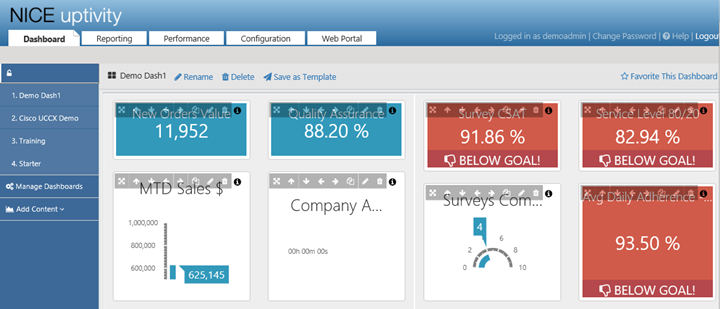
Each dashboard consists of one or more panels, and the panels in turn have a one-column or two-column layout. Each panel contains content, such as widgets, lists, or reports. This section discusses how to design dashboards; the following section deals with how to manage the dashboard content.
Related Tasks
- Adding Panels
- Creating a New Dashboard from a Published Template
- Creating a New Dashboard Without a Template
- Customizing the Starter Dashboard
- Editing Dashboards