Web Player
inContact WFO is configured to use either the Web Player or the HTML5 Interaction Player. Both players are launched from the Recorded Interactions page. If you are unsure which player is used in your system, ask your inContact WFO administrator.
This topic explains the controls and settings available when using the Web Player.
For more information, see Recording Playback Overview
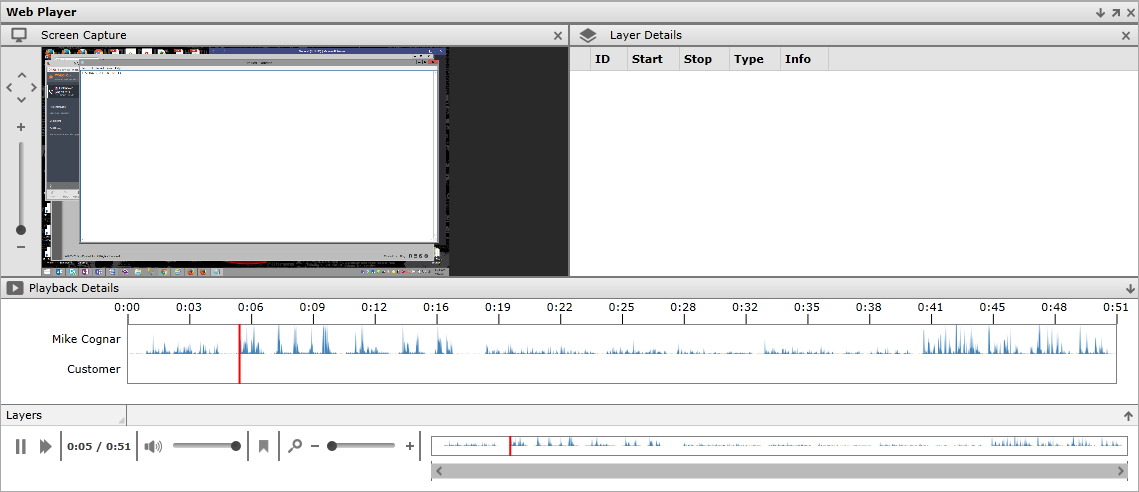
The Web Player consists of up to three panes:
- Playback Details Pane
- Layer Details Pane
- Screen Capture Pane (shown only if your organization uses inContact Screen Recording)
You can manipulate the player and its panes to customize your playback experience using the common interface control icons in the upper-right corner of the interface. The icons include:
- An upward-pointing arrow to expand panes
- A downward-pointing arrow to shrink panes
- An x to hide panes
- A diagonal arrow to launch the Web Player in a separate window
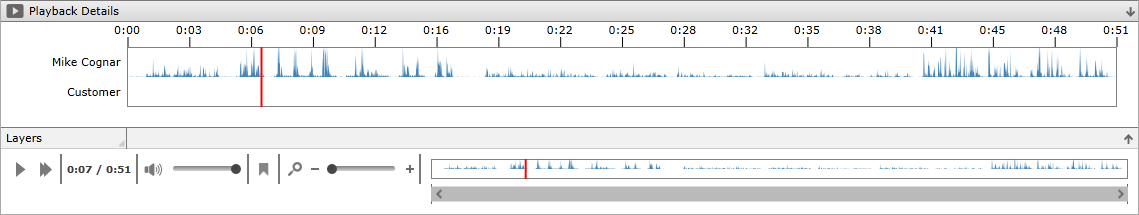
Playback Details Pane
Playback Controls
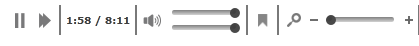
The Play and Pause icons are similar to those you would see on any standard media player. You can toggle between these icons to start and stop playback.
The Playback Speed Selection icon appears to the right of the Play/Pause icon. When you click this icon, a pop-up menu lets you select the appropriate speed. Audio pitch is not affected by changes in playback speed. Playback speed options are:
- Faster — 200% of normal speed.
- Fast — 150% of normal speed.
- Normal — 100% of normal speed.
- Slow — 75% of normal speed.
The interaction timer displays the current point of time in playback, and the total duration of the call, in HH:MM:SS format.
Volume controls are also similar to those found in standard media players. You can click the volume icon to mute and unmute playback, or use the slider to adjust the volume up or down. The current volume level (0-100%) is displayed when the mouse hovers over the slider bar(s).
The Web Player volume control is limited by the master volume level set in your Windows audio settings. You may need to adjust these settings to make the Web Player controls effective.
The bookmark icon appears if you have permission to bookmark calls, and can be used to add an internal bookmark to the recording.
Waveform Display
By default, the waveform display is visible at the bottom right of the Playback Details Pane. The image at the start of this topic shows the display after it has been expanded (in other words, after the upward pointing arrow was clicked).
Before expansion, you can click at any point in the display and the playback marker will move to that position and play back the interaction from that point. If this is outside the length of the viewable area control, playback will still occur, but progress will not be visible in the Playback Details pane.
The expanded waveform display offers additional viewing controls: the waveform zoom slider and the viewable time scroll bar. When you move the waveform zoom slider from left to right, the zoom level and waveform detail increase. With the view zoomed in, you can use the horizontal viewable time scroll bar to reposition the view within the waveform.
The waveform display shows audio activity on the line for the duration of the call.
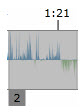
The waveform display also shows indicators that provide additional information about the interaction. These indicators are overlaid on the display in separate layers, so you can adjust which layers are visible.
In this image, you can see several types of indicators, with each type in a separate layer. If indicators for different items overlap, their number tags are stacked. You can move your mouse over the corresponding indicator to see a more detailed window containing layer details ID numbers and timestamps.
By expanding the Layers section of the Playback Details pane, you can see a listing of the different layers, and adjust which ones are visible. For example, you might choose to remove the cross-talk layer to focus on bookmarks. The following table provides additional information about waveform indicators.
| Indicator | Reference Information |
|---|---|

|
Playhead Indicator — shows what point of the call is currently playing back. Drag this indicator to any point in the waveform display to start playback at that point. While the playhead is being moved, the duration status will change to match its position. |

|
Silence — periods when neither party is speaking during a call. Shaded magenta in the waveform display. Click the number (in this case, 14) to seek to the corresponding ID in the Layer Details pane. Only available if silence detection has been configured. |

|
Bookmarks — internal bookmarks are denoted with a blue indicator. Click the number (in this case, 1) to seek to the corresponding ID in the Layer Details pane. |
|
Blackouts — specific sections of audio or video that have been blacked out are shaded black in the waveform display. Click the number (in this case, 6) to seek to the corresponding ID in the Layer Details pane. This feature is only available if blackouts have been configured. There may be a very slight (less than one second) difference between start/stop points in the display and actual start/stop of the blackout. |
Layer Details Pane
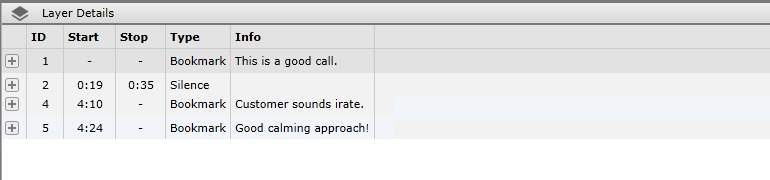
The Layer Details pane provides additional information about the tags shown in the various layers on the waveform display, including any metadata added to the call after it was recorded. The pane shares horizontal space with the Screen Capture pane (if your organization uses inContact Screen Recording). To minimize either pane, click the icon to the left of the pane header.
Data in the pane is organized into these columns:
- ID
- Identifier (for example, 1, 2, 3, A, B) for the tag. For data tagged at a specific time within a call, this ID also appears on the waveform display.
- Start
- For data tagged at a specific point within a call, the starting location of the tag is listed in mm:ss format. For data that is not tagged at a specific point inside a call, the time "00:-01" is listed.
- Stop
- Indicates the ending point for data relative to its starting point. Some data types, like bookmarks will not have a stop time, but instead display a dash (-).
- Type
- Indicates the type of tag: bookmark, silence, or other type.
- Info
- Data contained in the tag. Information in this field can vary, depending on the tag type. For bookmarks, the bookmark notes display here (for example, "Great sales pitch").
The type of data determines which columns are populated. You can resize column width by hovering your mouse over the borders between column headings. When the cursor changes to a double-headed arrow, click and drag to resize. You can also sort data in ascending or descending order by clicking a column heading.
Clicking the expand icon (indicated by a plus sign) displays a list of information and options relative to that particular item.
These options vary depending on the type of item and whether or not you created the item, but can include:
- Seek — moves the playhead indicator on the waveform to the place in the interaction where the item occurs.
- Edit — allows changes to be made to the item, such as updating notes or the bookmark time stamp.
- Delete — removes the item from the interaction and the waveform.
When you click the second-level expand icon, you can see whether the tag is public or private. Tags created by inContact WFO (for example, tags showing silence or automated blackouts) are always public.
Screen Capture Pane
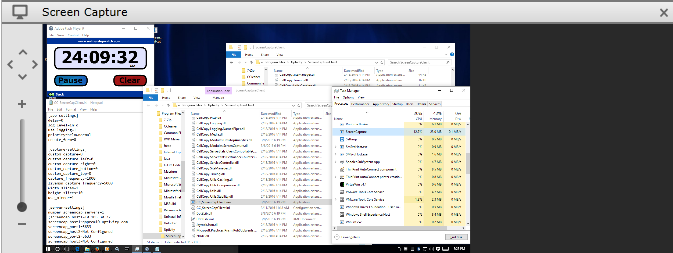
The Screen Capture pane is available only if your system includes inContact Screen Recording. It displays a scaled-down feed of recorded video for the call. The pane shares horizontal space with the Layer Details pane. You can minimize either pane by clicking the icon to the left of the pane header.
You can move your view within the Screen Capture pane by using the arrow icons. An alternative way to reposition video playback is to click on the video and drag until the desired area is in view.
You can increase or decrease the size of video playback by using the zoom slider shown at the left of the pane. Alternatively, you can resize the display by dragging either the right edge of the pane or the top border of the Web Player.
Video is auto-scaled to fit the window when playback begins, but you can zoom in up to 100% of the original capture size. You can also adjust playback zoom by scrolling the mouse inside the playback pane.
If you use the Recorded Interactions with Web Player, mouse-scroll zoom in the playback pane only works in Internet Explorer. This is due to Microsoft Silverlight limitations.