HTML5 Interaction Player
The HTML5 Interaction Player launches when you take action to play a recording from the Recorded Interactions page.
This topic explains the controls and settings available when using the HTML5 Interaction Player.
For more information, see Recording Playback Overview
The HTML5 Interaction Player is not supported by Internet Explorer.
Video playback is not supported with HTML5 Interaction Player in versions prior to 18.1.
The HTML5 Interaction Player consists of up to three panes:
- Playback Details Pane
- Layer Details Pane
- Screen Capture Pane (shown only if your organization uses NICE Uptivity Screen Recording)
You can close the player by clicking the "x" in the upper right corner. Closing the HTML5 Interaction Player closes all of its panes.
Playback Details Pane
Playback Controls

The Play and Pause icons are similar to those you would see on any standard media player. You can toggle between these icons to start and stop playback.
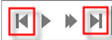
When the call segments feature is used, previous and next icons (as shown in the previous image) appear to the left and right of the play/pause and playback speed icons. They allow you to skip between sequential related calls. This function is not supported when you choose to play the interaction in a new window. For more information, see Find Call Segments.
The interaction timer displays the current point of time in playback, and the total duration of the call, in HH:MM:SS format.
Volume controls are also similar to those found in standard media players. You can click the volume icon to mute and unmute playback, or use the slider to adjust the volume up or down. The current volume level (0-100%) is displayed over the slider bar.
If your system is configured to save files in stereo CSA format, you will see dual volume control sliders. These can be used to raise or lower the volume of the individual audio streams.
The HTML5 Interaction Player volume control is limited by the master volume level set in your Windows audio settings. You may need to adjust these settings to make the HTML5 Interaction Player controls effective.
The bookmark icon appears if you have permission to bookmark calls, and can be used to add an internal bookmark to the recording.
On the far right of the player control bar are two icons. The first allows you to expand the waveform display and see additional playback controls. The second allows you to expand the tag legend for the waveform display. These features are discussed in the following section.
Waveform Display
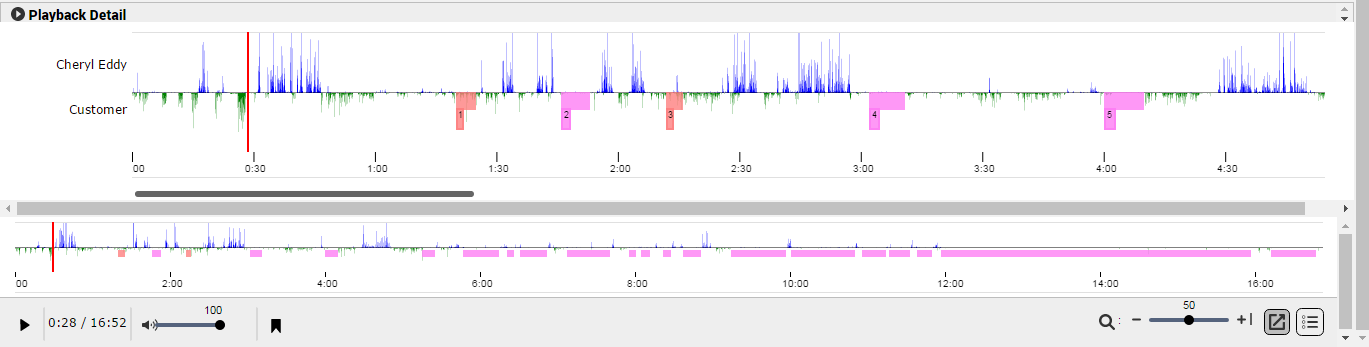
By default, the waveform display is visible at the bottom of the Playback Details Pane. You can click the expansion icon (designated by a square with arrow pointing up and right) to expand the display so you can see and interact with it more easily.
Before expansion, you can click at any point in the display and the playback marker will move to that position and play back the interaction from that point. If this is outside the length of the viewable area control, playback will still occur, but progress will not be visible in the Playback Details pane.
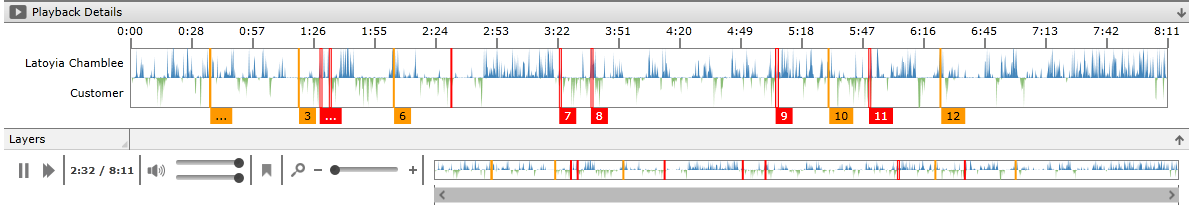
The preceding image shows an expanded waveform display. A new, larger waveform is displayed above the original. The expanded display offers additional viewing controls: the position zoom icon, the waveform zoom slider, and the viewable time scroll bar.
When you click a point in the original waveform, and then click the position zoom icon (designated by a magnifying glass), the expanded waveform changes to display that portion of the recording.
When you move the waveform zoom slider from left to right, the zoom level and detail increase in the expanded waveform.
You can use the horizontal viewable time scroll bar (visible between the two waveforms) to reposition the view within the expanded waveform.
Both the original and expanded waveform displays show audio activity on the line for the duration of the call.
The expanded waveform display also shows indicators that provide additional information about the interaction. These indicators are overlaid on the display in separate layers, so you can adjust which layers are visible.
In this image, you can see several types of indicators, with each type in a separate layer. If indicators for different items overlap, their number tags are stacked. You can move your mouse over the corresponding indicator to see a more detailed window containing layer details ID numbers and timestamps.
By clicking the tag legend icon at the far right of the player controls bar, you can see a listing of the different layers, and adjust which ones are visible. For example, you might choose to remove the silence layer to focus on bookmarks. The following table provides additional information about waveform indicators.
| Indicator | Reference Information |
|---|---|

|
Playhead Indicator — shows what point of the call is currently playing back. Drag this indicator to any point in the waveform display to start playback at that point. While the playhead is being moved, the duration status will change to match its position. |
|
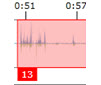
Cross-talk — times when both parties on the line are speaking simultaneously. Shaded red in the waveform display. Click the number (in this case, 13) to seek to the corresponding ID in the Layer Details pane. Only available if cross-talk detection has been configured. |

|
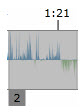
Silence — periods when neither party is speaking during a call. Shaded magenta in the waveform display. Click the number (in this case, 14) to seek to the corresponding ID in the Layer Details pane. Only available if silence detection has been configured. |
|
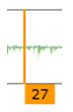
Speech Tags — when NICE Uptivity Speech Analytics checks a call and detects key words or phrases based on established criteria, indicators are placed on the waveform to show what the tags are and where they occur in the call. Click the number (in this case, 27) to seek to the corresponding ID in the Layer Details pane. Only available in systems that include NICE Uptivity Speech Analytics. |

|
Bookmarks — internal bookmarks are denoted with a blue indicator. Click the number (in this case, 1) to seek to the corresponding ID in the Layer Details pane. |
|
Blackouts — specific sections of audio or video that have been blacked out are shaded black in the waveform display. Click the number (in this case, 6) to seek to the corresponding ID in the Layer Details pane. This feature is only available if blackouts have been configured. There may be a very slight (less than one second) difference between start/stop points in the display and actual start/stop of the blackout. |
Layer Details Pane
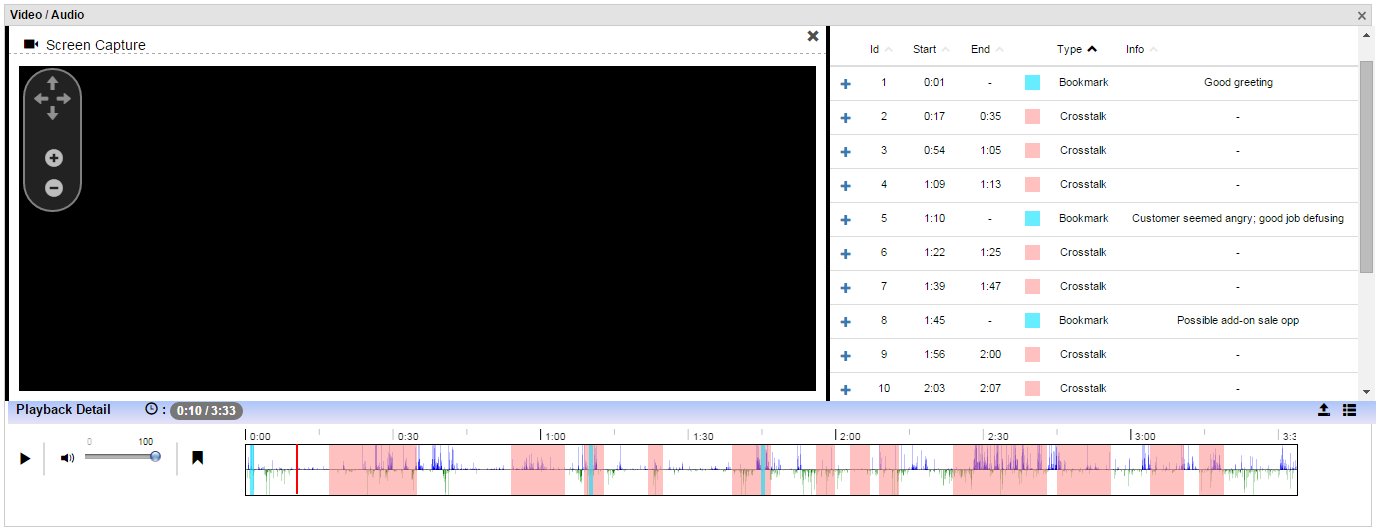
The Layer Details pane provides additional information about the tags shown in the various layers on the waveform display, including any metadata added to the call after it was recorded. The pane shares horizontal space with the Screen Capture pane (if your organization uses NICE Uptivity Screen Recording). You can click and drag the boundary line between the two panes to change their relative size.
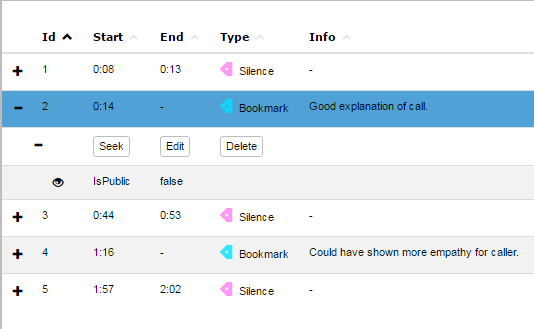
Data in the pane is organized into these columns:
- ID
- Identifier (for example, 1, 2, 3, A, B) for the tag. For data tagged at a specific time within a call, this ID also appears on the waveform display.
- Start
- For data tagged at a specific point within a call, the starting location of the tag is listed in mm:ss format. For data that is not tagged at a specific point inside a call, the time "00:-01" is listed.
- Stop
- Indicates the ending point for data relative to its starting point. Some data types, like
- Type
- Indicates the type of tag: bookmark,
- Info
- Data contained in the tag. Information in this field can vary, depending on the tag type. For bookmarks, the bookmark notes display here (for example, "Great sales pitch").
The type of data determines which columns are populated. You can sort data in ascending or descending order by clicking a column heading.
In the preceding image, the expand icon (indicated by a plus sign) has been clicked for ID
These options vary depending on the type of item and whether or not you created the item, but can include:
- Seek — moves the playhead indicator on the waveform to the place in the interaction where the item occurs.
- Edit — allows changes to be made to the item, such as updating notes or the bookmark time stamp.
- Delete — removes the item from the interaction and the waveform.
For bookmarks and speech tags, additional information is displayed when you click the expand icon. Bookmarks indicate whether the bookmark is public or private. Speech tags show confidence (likelihood of match), tag group (if specified by your organization during setup), and the detected phrase.
Screen Capture Pane
The Screen Capture pane is available only if your system includes NICE Uptivity Screen Recording. It displays a scaled-down feed of recorded video for the call. The pane shares horizontal space with the Layer Details pane. You can click and drag the boundary line between the two panes to change their relative size.
You can move your view within the Screen Capture pane by using the arrow icons. An alternative way to reposition video playback is to click on the video and drag until the desired area is in view.
You can increase or decrease the size of video playback by clicking the + or - icons in the controls at the upper left corner of the pane. You can also reposition your view within the pane by using the up, down, left, or right arrows in the controls.
Video is auto-scaled to fit the window when playback begins, but you can zoom in up to 100% of the original capture size.