

It's normal to have some silence![]() When neither party is talking during an interaction. Is notable after three or more seconds. Total notable silence is the sum of all notable silence periods. in your interactions
When neither party is talking during an interaction. Is notable after three or more seconds. Total notable silence is the sum of all notable silence periods. in your interactions![]() The full conversation with an agent through a channel. For example, an interaction can be a voice call, email, chat, or social media conversation.. But how much is too much? When it is too much, how can you fix it? Follow this success guide to design a workspace
The full conversation with an agent through a channel. For example, an interaction can be a voice call, email, chat, or social media conversation.. But how much is too much? When it is too much, how can you fix it? Follow this success guide to design a workspace![]() Named view of one or more widgets. focused on interaction silence. Decreasing interaction silence can benefit your organization in the following ways:
Named view of one or more widgets. focused on interaction silence. Decreasing interaction silence can benefit your organization in the following ways:
-
Reduce average handle time (AHT): Analyzing silence can help you find ways to reduce AHT
 Average Handle Time is the average amount of time an agent spent handling an interaction.. Decreasing the average handle time increases agent efficiency.
 -
Reduce callbacks: Analyzing silence can help ensure contacts
The person interacting with an agent, IVR, or bot in your contact center.' issues are resolved the first time they call about them. Fewer callbacks means having more time and resources available to help more customers. You can reduce callbacks by finding gaps in agent knowledge and improving processes. -
Call avoidance: One type of call avoidance happens when an agent accepts an interaction to appear productive but doesn't actually talk to the contact. Analyzing silence can help you identify agents who are being dishonest or inefficient with their time.
-
Improve customer satisfaction: Interactions with long silence time sometimes correlate to lower client sentiment
Overall mood or result of the interaction as determined by analysis of words, phrases, and context of the transcript.. Improving silence time may also help you improve sentiment.
Classics, Inc. wants to identify gaps in agent training that may impact silence time. They also want to see if they can improve business processes to cut down on silence time. They want to compare agents by average silence time. They decide to analyze the silence of two different teams to compare the agents by average silence time. The Kansas team is a new team made up of newer agents. The Emerald City team has more experienced agents. Classics is interested in discovering:
- What causes high silence times and low silence times.
- How agents may use their time ineffectively or inappropriately.
- How silence time correlates to things like sentiment Overall mood or result of the interaction as determined by analysis of words, phrases, and context of the transcript. or agent efficiency.
- How they can use what they find to enhance agent training and company processes.
- If changes to agent training or processes impact silence time.
How Silence is Defined
Silence is considered notable if it lasts three or more seconds. Total notable silence for an interaction![]() The full conversation with an agent through a channel. For example, an interaction can be a voice call, email, chat, or social media conversation. is the sum of all notable silence
The full conversation with an agent through a channel. For example, an interaction can be a voice call, email, chat, or social media conversation. is the sum of all notable silence![]() When neither party is talking during an interaction. Is notable after three or more seconds. Total notable silence is the sum of all notable silence periods. periods. Note that notable silence is defined differently for voice calls than for chat interactions.
When neither party is talking during an interaction. Is notable after three or more seconds. Total notable silence is the sum of all notable silence periods. periods. Note that notable silence is defined differently for voice calls than for chat interactions.
Notable silence for voice calls:
Is an interval or period of silence when neither the agent nor customer is speaking. This also includes any time the customer spends on hold. You can look at silence time in seconds or as a percentage. The total silence percentage for an interaction is relative to the length of the whole interaction. For example, two minutes of silence during a 10-minute call is a much higher percentage than two minutes during an hour-long call.
Notable silence for non-voice interactions:
Is calculated for the total interaction. The system assumes that some silence is normal since non-voice interactions are asynchronous. It allows time to read and respond to a message before it begins counting notable silence. The estimated writing time is 40 words per minute (wpm). The estimated reading time is 250 wpm. This provides agents and contacts time to re-read and type a response before silence time is counted.
Silence is not calculated for email interactions.
Set Up a Silence Workspace
These instructions are a recommendation for how to build a workspace![]() Named view of one or more widgets.. They're meant to help you get started. You can customize workspaces in many other ways to suit your organization's needs. You can configure a dataset workspace using other widgets
Named view of one or more widgets.. They're meant to help you get started. You can customize workspaces in many other ways to suit your organization's needs. You can configure a dataset workspace using other widgets![]() Graphical representation of data that meets specified filter criteria., metrics
Graphical representation of data that meets specified filter criteria., metrics![]() Statistics you can measure to keep track of your contact center., and filters not mentioned here.
Statistics you can measure to keep track of your contact center., and filters not mentioned here.
Categories![]() Data groups that Interaction Analytics (CXone) uses for parsed call transcript data. They make it easier to find trends. are the foundation for analysis in Interaction Analytics (CXone). Category sets and categories help you group and identify information most relevant to your interests. We recommend using the Agent Performance or Contact Center Highlights categories with this workspace.
Data groups that Interaction Analytics (CXone) uses for parsed call transcript data. They make it easier to find trends. are the foundation for analysis in Interaction Analytics (CXone). Category sets and categories help you group and identify information most relevant to your interests. We recommend using the Agent Performance or Contact Center Highlights categories with this workspace.
You can use a silence![]() When neither party is talking during an interaction. Is notable after three or more seconds. Total notable silence is the sum of all notable silence periods. workspace to increase your organization's overall efficiency. There are multiple ways to accomplish that goal. Choose one of the following workspace setup options that best supports your goals and interests:
When neither party is talking during an interaction. Is notable after three or more seconds. Total notable silence is the sum of all notable silence periods. workspace to increase your organization's overall efficiency. There are multiple ways to accomplish that goal. Choose one of the following workspace setup options that best supports your goals and interests:
-
If you want to focus on how agent behavior affects interaction silence, create an agent-focused workspace. Classics, Inc. uses this workspace setup to accomplish their goal to fill gaps in agent training.
Create an Agent-Focused Workspace
- Go to My Data and open the dataset you want to analyze.
- Click the workspace panel
 if it is not already open, then click Add Workspace.
 - Click the Widget Drawer
 .
. - Select the following widgets in the order given, to add them to your workspace:
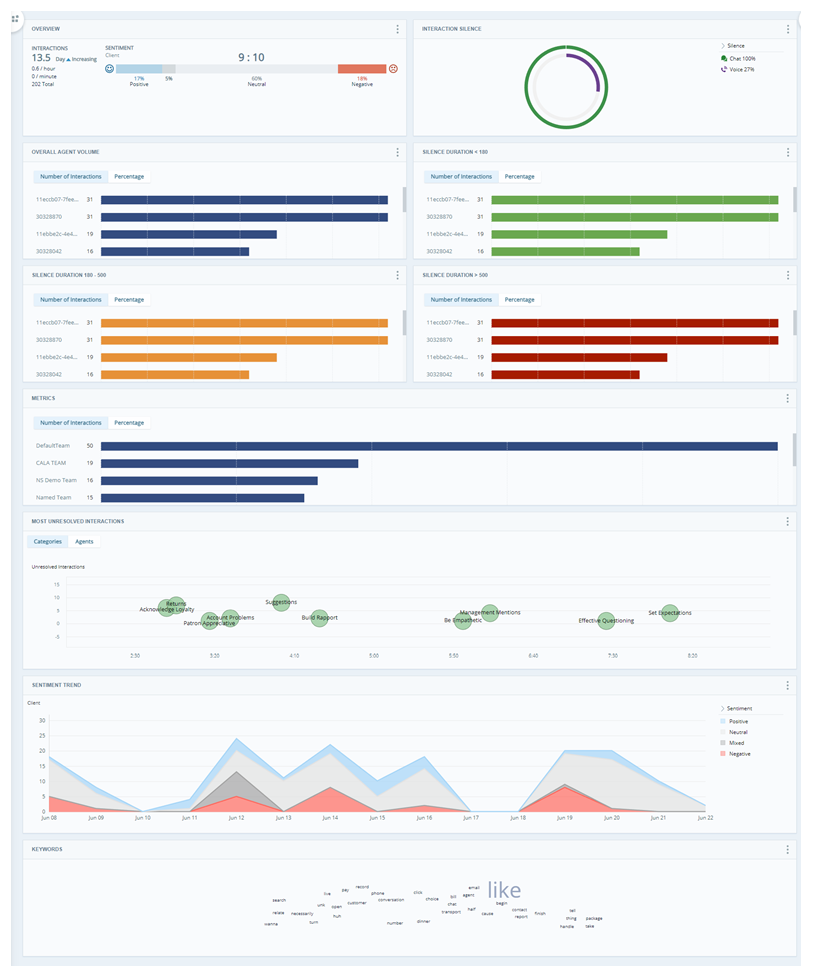
Overview Bar, under the Volume section.
Silence Percentage, under the Volume section.
Metrics, under the Volume section. Select this widget four more times, so that a total of five appear in your workspace.
Unresolved, under the Volume section.
Sentiment Trend, in the Sentiment section.
Keywords, under the Volume section.
Some of these widgets require more configuration after you add them to the workspace. This is so you can view specific data related to silence. Other widgets use the default settings.
- You can edit any of the widgets to adjust their size or position.
Configure Metrics Widgets
Configure one Metrics widget to display the overall volume of interactions handled by each agent.
Then configure additional widgets to see interactions by agent ID and silence time. It's helpful to configure one Metrics widget with a short silence range, another with a medium silence range, and another for a long silence range. This helps to group interactions by silence time and discover the reasons behind notable silence.
Configure an additional Metrics widget to view the volume of interactions handled by team. This makes it easier to view how data for different teams is affected by workspace filters.
Classics, Inc. wants to separate their agents into three separate groups based on different silence time intervals. So, they configure three Metrics widgets to display interactions by Agent ID. Then they apply filters to each widget, using the Notable Silence Percentage metric as follows:
-
They configure one widget to only display interactions with a Minimum of 0 and a Maximum of 25 percent.
-
They filter another to only display interactions with a Minimum of 26 percent and a Maximum of 50 percent.
-
Classics configures a third metrics widget to only display interactions with a Minimum of 51 percent.
This allows them to see and compare interactions with short, medium, and long intervals of silence. This makes it easier to see what types of things agents with shorter silence are doing well. And it makes it easier to identify what is causing longer silences.
You can also choose to use the Notable Silence Seconds metric. This will display the exact amount of silence time in seconds instead of the silence percentage for the interaction.
- Click more options
 > Settings in the top right corner of the first Metrics widget. Change the widget Title to Overall Agent Volume.
 - Click the Widget Options drop-down and for Field, select Agent ID.
- For Number to Show, enter a number from 1–25, the number of agents you want the widget to display data for. The default is 10.
- You can customize the bar color or order in which the bars display in the widget. Configure each Metrics widget with a different color, so you can easily tell them apart.
- Select a Default View for the widget. This will display either the Count or Percentage of all interactions for each agent. Regardless of the default view you select, you can still toggle between both view options in the widget.
- Click OK.
- Repeat these steps for the next three Metrics widgets, so they also display interactions by agent ID.
- To configure a widget for a silence interval, click
 in the top right corner of the widget.
 - Click Add Filters and expand the Metrics filter.
- Select Notable Silence Percentage.
- Expand the Notable Silence Percentage filter you just added and select a Minimum and Maximum value for the percentage range. You can use + and - or enter an integer.
- Click the magnifying glass
 at the top of the workspace.
 - Click more options > Settings to change the widget Title to Silence Duration (the interval you selected). For example, you could change the name to Silence Duration (0- 25%).
- Click OK.
- Repeat these steps for the next two Metrics widgets. But select different operators and values to filter for medium and long periods of silence. The number and length of silence interval ranges are suggestions that may not fit every business. Adjust them based on your average and baseline silence percentages.
- To configure the teams widget, click the Widget Options drop-down and for Field, select Team Name. This widget cannot display more than 25 bars at a time. If you wish to view data for more teams than that, it's best to use a workspace filter instead.
- Change the widget Title to Team Name.
- Click OK.
-
If you want to focus on how company processes affect interaction silence, create a process-focused workspace. Classics, Inc. uses this workspace setup to accomplish their goal to improve processes.
Create a Process-Focused Workspace
- Go to My Data and open the dataset you want to analyze. If you want to be able to apply this workspace to multiple datasets, you can also create a workspace as a template instead.
-
If the workspace pane is not already open, click
in the top left, then click Add Workspace. - Click the Widget Drawer on the right side of the workspace.
- Select the following widgets in order to add them to your workspace:
Overview Bar, under the Volume section.
Silence Percentage, under the Volume section. Select this widget two more times, so that a total of three appear in your workspace.
Metrics, under the Volume section. Select this widget a second time, so that two appear in your workspace.
Unresolved, under the Volume section.
Sentiment Trend, under the Sentiment section.
Keywords, under the Volume section.
Some of these widgets require more configuration after you add them to the workspace. This is so you can view specific data related to silence. Other widgets use the default settings.
- You can edit any of the widgets to adjust their size or position.
Configure Metrics Widgets
Configure one Metrics widget to display the overall volume of interactions handled by each agent. Configure an additional Metrics widget to view the volume of interactions handled by team.
- Click more options > Settings in the top right corner of the first Metrics widget. Change the widget Title to Overall Agent Volume.
- Click the Widget Options drop-down and for Field, select Agent ID.
- For Number to Show, enter a number from 1–25, the number of agents you want the widget to display data for. The default is 10.
- You can customize the bar color or order in which the bars display in the widget. Configure each Metrics widget with a different color, so you can easily tell them apart.
- Select a Default View for the widget. This will display either the Count or Percentage of all interactions for each agent. Regardless of the default view you select, you can still toggle between both view options in the widget.
- Click OK.
- Repeat these steps for the second Metrics widget but for Field, select Team Name. Make the same customizations and give the widget a new Title, such as Overall Team Volume.
- Click OK.
Configure Interaction Silence Widgets
Configure one Interaction Silence widget with a short duration range, another with a medium duration range, and another for a long duration range. This helps to group interactions by duration length and discover the reasons behind longer periods of silence.
Classics, Inc. wants to group interactions by duration. So, they configure three Interaction Silence widgets to display different duration intervals. Then they apply filters to each widget, using the Interaction Duration Secondsmetric as follows:
-
They configure one widget to only display interactions with a Minimum of 0 and a Maximum of 300 seconds.
-
They filter another to only display interactions with a Minimum of 301 seconds and a Maximumof 900 seconds.
-
Classics configures the third Interaction Silence widget to only display interactions with a Minimum of 901 seconds.
This will help them see relationships between interaction length and silence percentage. If longer interactions also have high silence percentages, Classics can determine that reducing their silence time will also reduce overall interaction duration length. They can also take a look at shorter calls with lower silence percentages to see ways they are already performing efficiently.
- To configure a widget for a duration interval, click the funnel icon in the top right corner of the first Interaction Silence widget.
- Click Add Filters and expand the Metrics filter.
- Select Interaction Duration Seconds.
- Expand the Interaction Duration Seconds filter you just added and select a Minimum and Maximum value for the duration seconds. You can use + and - or enter an integer. For example, you could select a Minimum of 0 and a Maximum of 300 seconds to see all interactions that fit into that interval.
- Click the magnifying glass icon at the top of the workspace.
- Click more options > Settings to change the widget Title to Duration (the interval you selected). For example, Duration (≤ 300).
- Click OK.
- Repeat these steps for the next two Interaction Silence widgets. But select different values to filter for medium and long interactions. The number and length of duration interval ranges are suggestions that may not fit every business. Adjust them based on your average duration and baseline silence percentages.
Categories: An Additional Resource
The following out-of-the-box category sets![]() Category groupings that help you use data for a specific purpose. Out-of-the-box category templates include Intent to Buy and Risk Aversion. may be helpful to identify topics or reasons associated with long intervals of notable silence
Category groupings that help you use data for a specific purpose. Out-of-the-box category templates include Intent to Buy and Risk Aversion. may be helpful to identify topics or reasons associated with long intervals of notable silence![]() When neither party is talking during an interaction. Is notable after three or more seconds. Total notable silence is the sum of all notable silence periods.:
When neither party is talking during an interaction. Is notable after three or more seconds. Total notable silence is the sum of all notable silence periods.:
-
The Contact Center Highlights category set identifies interactions
The full conversation with an agent through a channel. For example, an interaction can be a voice call, email, chat, or social media conversation. that demonstrate common issues, inquiries, and agent performance. -
The Agent Performance category set has a subset called Agent Behaviors that can help you identify:
-
Negative agent behaviors.
-
Positive agent behaviors.
-
Areas where the agent is not knowledgeable.
-
When agents are difficult to understand.
-
Other agent limitations.
-
Call quality issues.
-
How to Use a Silence Workspace
Start by developing a theory about silence![]() When neither party is talking during an interaction. Is notable after three or more seconds. Total notable silence is the sum of all notable silence periods. time. Consider when and how much silence time you think is appropriate for interactions
When neither party is talking during an interaction. Is notable after three or more seconds. Total notable silence is the sum of all notable silence periods. time. Consider when and how much silence time you think is appropriate for interactions![]() The full conversation with an agent through a channel. For example, an interaction can be a voice call, email, chat, or social media conversation. for your organization. Then estimate how much silence time you think exists in your interactions. Each widget displays details to help you test your theory. Compare widgets side by side to see specific issues. Your observations help you determine what filters can identify areas for improvement. The widget data that displays in the workspace
The full conversation with an agent through a channel. For example, an interaction can be a voice call, email, chat, or social media conversation. for your organization. Then estimate how much silence time you think exists in your interactions. Each widget displays details to help you test your theory. Compare widgets side by side to see specific issues. Your observations help you determine what filters can identify areas for improvement. The widget data that displays in the workspace![]() Named view of one or more widgets. depends on the dataset parameters set for the dataset.
Named view of one or more widgets. depends on the dataset parameters set for the dataset.
Overview Bar Widget
The Overview Bar widget gives you general idea of how sentiment![]() Overall mood or result of the interaction as determined by analysis of words, phrases, and context of the transcript. is trending throughout all interactions in the dataset
Overall mood or result of the interaction as determined by analysis of words, phrases, and context of the transcript. is trending throughout all interactions in the dataset![]() Set of parsed interaction transcripts that spans a specific period of time and match your specified filter criteria.. You can filter the widget
Set of parsed interaction transcripts that spans a specific period of time and match your specified filter criteria.. You can filter the widget![]() Graphical representation of data that meets specified filter criteria. or the entire workspace by silence percentage or silence seconds to see how silence time affects sentiment trends.
Graphical representation of data that meets specified filter criteria. or the entire workspace by silence percentage or silence seconds to see how silence time affects sentiment trends.
Interaction Silence Widget
The Interaction Silence widget displays extended periods of silence as a percentage of the total interaction time in chat and voice interactions.
In this setup option, only one Interaction silence widget appears. Try applying different workspace filters. Observe how that affects the data that displays in the widget. Click the circles in the chart to open the Interactions widget. Review individual interaction transcripts![]() Written form of all or part of a voice or digital interaction. and recordings to find more insights. Pay attention to the agent side of the interaction to discover areas to help them improve.
Written form of all or part of a voice or digital interaction. and recordings to find more insights. Pay attention to the agent side of the interaction to discover areas to help them improve.
In this setup option, the widgets separate interactions into groups by length. This view shows silence time relative to the total length of interactions.
Click the funnel icon in the top right corner of your workspace. Click Add Filters and use the Categories filter. Select categories associated with organizational processes. This can help you identify reasons associated with interactions of a certain length. These reasons highlight opportunities to improve processes. Click the circles in the chart to open the Interactions widget. Review individual interaction transcripts and recordings to find more insights.
Metrics Widgets
In this setup option, the first Metrics widget shows the overall volume of calls by agent, and the next three widgets filter the interactions into groups of less than, between, and more than a specific length of notable silence seconds. The last metric widget shows the overall volume by team name.
Configuring Metrics widgets this way can help identify:
-
Agents who achieve less than average notable silence seconds.
-
Agents who perform as expected.
-
Agents with higher than anticipated notable silence seconds.
Classics, Inc. filtered the Metrics widget to display interactions by Agent Name. Then they filtered the workspace to only show interactions with a minimum of 70% silence. They reviewed individual interaction records for the agents with the highest silence times. They discovered call avoidance, where agents accepted interactions to appear productive, but didn't actually talk to the client. This allowed Classics to identify agents that needed to be reprimanded or terminated. They further adjusted silence time filters to find other agents guilty of call avoidance and others with high silence times in need of training. Making these changes helped Classics significantly decrease the overall average silence time.
In this setup option, one Metrics widget shows the overall volume of calls by agent ID. A second one shows the overall volume by team name. This helps you focus on specific agents and teams with high silence times.
Use the data that appears in these widgets to determine how to filter this workspace for a more detailed analysis. You can also click more options > Settings in the widget to edit the display.
Click any of the bars in the widget and click Show Interactions to see more details.
Most Unresolved Interactions Widget
The Most Unresolved Interactions widget displays the most common unresolved interactions in your contact center. The widget offers both a category view and agent view. The chart displays categories by average talk time. The category view demonstrates what kinds of issues are often not resolved in a single interaction.
Filter the widget or workspace by silence to see what agents and categories are most affected. Investigate individual interactions to discover the causes of unresolved interactions. Click the drop-downs below for more specific instructions for different scenarios.
A data analyst at Classics, Inc. reviewed a call transcript. In the transcript, the agent told the client to “call back later” because they didn't know how to answer their question. This indicates that Classics needs a process for addressing unresolved questions. They might also want to train agents on how to determine when a question is unanswerable.
-
Filter the workspace to only display interactions with the silence percentage present in those unresolved interactions.
-
Click the funnel icon
in the top right corner of your workspace. -
Click Add Filters and expand the Metrics drop-down.
-
Select Notable Silence Percentage.
- Expand the Notable Silence Percentage filter you just added and select a Minimum and Maximum value for the percentage range. You can use + and - or enter an integer. For example, you can select a Minimum of 30 percent.
- Click the magnifying glass icon at the top of the workspace. The Most Unresolved Interactions widget now displays the top agents with the most unresolved interactions and high silence.
-
-
Add a filter to see if these agents give up on the interaction once they know it’s a topic where they feel ill-equipped.
-
Click the funnel icon
in the top right corner of your workspace. -
Click Add Filters and expand the Categories drop-down.
- Select Agent Behaviors > Agent Performance Negative > Agent Not Knowledgeable.
- Click the magnifying glass icon at the top of the workspace to only view interactions in these categories.
- Go to the Keywords widget and remove any irrelevant terms. To remove a term, click it, then select Hide Term.
-
-
Review individual interactions to see if agents give up immediately or after a length of silence.
-
Review specific interactions that appear in the category. Consider what processes may need to be implemented to help reduce silence.
-
Note common topics, questions, or processes requiring your agents to take a longer than expected amount of silence time to answer.
Review the amount of silence time present in each type of unresolved interaction. Click the drop-downs below to see suggested solutions for each scenario:
A Classics, Inc. analyst noticed that there was a high quantity of unresolved calls with short silence duration. They reviewed other interaction recordings and determined that many customers were calling about the same issue. In this case, agents seemed to know there wasn't an answer for the problem. This helped Classics realize that they needed to develop a new process to address the issue.
Unresolved interactions with short silence times may occur for a couple reasons:
-
Agents are aware of issues but are unable to help resolve company processes beyond their control.
-
In this case, consider solutions to improve complicated or problematic company processes.
-
-
Customers may often call with expectations higher than an agent's skill level. This may lead to multiple transfers to try and get them the information they need.
-
In this case, consider developing a self-service flow in the IVR
Interactive Voice Response. Automated phone menu contacts use via voice or key inputs to obtain information, route an inbound voice call, or both. to help reduce interaction silence.
-
-
Consider solutions to improve complicated or problematic processes.
-
Brainstorm how to improve agent training so agents are more confident and knowledgeable on these topics.
Sentiment Trend Widget
The Sentiment Trend widget allows you to drill down to individual contacts contributing to sentiment spikes. Some spikes are just increases in call volume, but the chart can show when the number of positive or negative calls fluctuates and allows you to investigate the cause.
At first glance, the Sentiment Trend widget may not provide much insight. Try adjusting the filters to see if changing the date range or notable silence yields something helpful. For example, if the trend shows a noticeable spike in negative sentiment, filter the workspace to the date range where the spike occurs. This allows you to focus on just those interactions, so you can more easily identify the root cause. For example, looking at a date range of 14 days instead of 90 days may help you discover a pattern that occurs weekly on a specific day.
Once the workspace is filtered by a notable silence interval, this widget shows the average sentiment of the interactions that meet that silence criteria.
If negative sentiment is higher than expected for a particular amount of notable silence, it may indicate an area to explore further. This can be helpful to determine if recommended processes are being followed. You can also determine how those processes can be improved.
Keywords Widget
The Keywords widget does not consider context or the meaning of keywords. So, it's important to review the word cloud and identify filler words and phrases to remove. For example, terms that appear frequently like hello, good, like, yep, help aren't very helpful. You can hide these terms to expose more meaningful ones. To hide irrelevant terms, click the term and then Hide. To take a closer look at individual interactions where certain words appear, click the term and then Show Interactions.
If you select Exclude instead of Hide, the phrase is added to the Keywords and Phrases workspace filter. This means that any interaction including the phrase is excluded from the widget as well as the workspace. Keep this in mind when you want to remove irrelevant phrases from the widget but keep the interactions where these keywords are stated.
Filtering the workspace can also help inspire you to add new words to categories. For example, if you find a new or unexpected term, you may want to create a new category to investigate or add it to an existing one.
Use the Metrics widgets or Interaction Silence widgets to determine what amount of silence is higher than average. Then try filtering the workspace for interactions with higher-than-average silence percentage. Use the Keywords widget to identify topics potentially correlated to higher silence seconds.
You can also filter the Keywords widget to display words by team name or skill. This could help determine if there are specific processes or behaviors they can improve.
Measure and Track Progress
A goal-focused workspace is most valuable when your insights are used to drive change. Be sure to measure and track your progress on a regular basis. This helps you see how you are improving and helps you set appropriate goals.
A Classics, Inc. analyst used this silence time workspace to compare these teams. She discovered that the Kansas team's interactions average silence time was 22% higher than the Emerald City team. She filtered the workspace to view interactions with both high and low silence times to find out why. Viewing individual interaction recordings and transcripts helped identify several ways to improve agent training as well as processes. They discovered that:
- Some agents on the Kansas Team were committing call avoidance. They accepted contacts to appear productive but never actually talked to them.
- Some of the agents on the Kansas team weren't confident in their knowledge about company policies.
- Most agents on the Emerald City team were very friendly and knowledgeable about products and procedures.
- Agents on both teams had to spend long amounts of time finding the information contacts needed because of inefficient processes.
In response to what they found, Classics, Inc., enhanced agent training and updated company processes to make important information easier to find.
A month later, Classics ran the Analytics Metric Statistics report again. It showed that the Kansas team lowered their average silence time by 10%. Classics continues to run the Analytics Metric Statistics report on a regular basis. They want to monitor progress until the Kansas team’s average silence time is equal to or lower than the Emerald City team.
Run the Analytics reports to view your progress. You could view data on a monthly basis or after a coaching session to track progress. Each time you run an Analytics report, you can compare that data to your baseline to measure your progress. Based on your improvements, you may also decide to use updated data to establish a new baseline to measure against. After you review insights from the workspace and Analytics reports, consider what milestones and supporting goals should come next to maintain a process of continuous improvement.
Assess Agents in Smaller Groups
After you run an analytics report, you will be able to establish a new baseline for performance. After you have measured the progress of a whole team, you can discover additional insights by monitoring agents in groups. Consider separating agents into four equal groups based on their average silence times. This provides you with lists of agents and interactions that fit into the following groups:
-
Very low silence time.
-
Lower than average silence time.
-
Higher than average silence time.
-
High silence time.
Use these groups to review interactions by percentages of silence. Note agents with longer periods of silence. Decide how to investigate further by identifying the agent, team, or interactions with the highest percentage of silence to determine what’s causing it.
Use the workspace to determine what amount of silence time is normal or to be expected. Then continue to filter the workspace to display interactions with equal or greater than the expected silence interval. Regularly monitor progress by exploring individual interactions to identify causes. These causes might include customer questions or processes that cause agents to spend long periods of time searching for answers. Use the Keywords widget to quickly identify common topics mentioned during interactions with longer-than-expected periods of silence.
Identify Individualized Training Opportunities
-
Clear all workspace filters by clicking the x next to each one. Then click the magnifying glass icon
. -
Review the metrics widget to identify the longest period of silence.
-
Filter the workspace by one agent at a time and review how the workspace data changes.
-
Click
in the top right corner of your workspace. -
Click Add Filters and expand the Metrics drop-down.
-
Select Agent Name or Agent ID. Enter or select the agent you want to view interactions for.
- Click the magnifying glass icon at the top of the workspace.
-
-
Look at the Keywords widget to identify specific topics the agent is struggling with.
-
Click
in the top right corner of the Keywords widget. -
Click Add Filters and select the Participant filter.
-
Expand the Participant filter you just added and select Agent.
-
Click Add Filters again and expand the Categories drop-down.
-
Select Agent Behaviors > Agent Performance Negative > Agent Not Knowledgeable.
- Click the magnifying glass icon at the top of the workspace.
-
Go to the Keywords widget and remove any irrelevant terms. To remove a term, click it, then select Hide Term. This will likely require a lot of work to dig deep and discover helpful keywords.
-
-
Review the Overview Bar widget and Sentiment Trend widget and check for a high volume of negative sentiment. Negative sentiment may indicate the agent has trouble navigating specific topics.
-
Review the Silence Percentage widget and click any of the circles in the chart displaying a high silence percentage. This opens the Interactions widget. From here, you can click on individual interactions to view transcript details. Be wary of multiple interactions where the agent doesn't respond at all. This may indicate dishonest or inappropriate agent behavior.
-
Communicate what you discover with the agent's manager. This might include recommending additional training or sharing what they are doing well. Also, share any process issues you discover with those able to make changes.
-
Repeat these steps for each agent, changing the name or ID in the filter each time.
-
After making changes based on your discoveries, run the Analytics Metric Statistics report again to establish a new baseline for silence. We recommend waiting at least four weeks before running the report again, to view measurable progress.
Your workspace will be most effective when you tie insights to business goals and strategies. It's also important to share insights with the people who have power to make change happen.