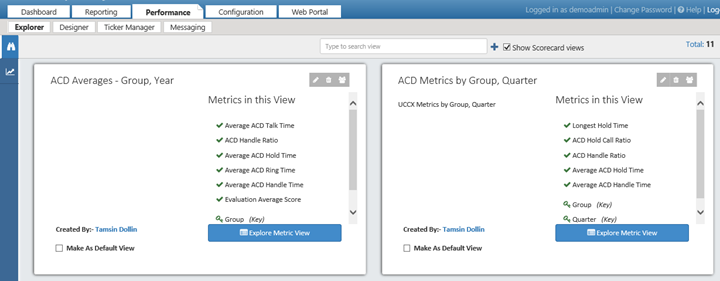
Metric Views Overview
Metric Views enable you to analyze and compare data from a collection of metrics, and are useful for exploring a collection of related KPIs![]() An acronym for Key Performance Indicator - a measurable value that demonstrates how effectively a company is achieving key business objectives.. The following considerations apply to metric views:
An acronym for Key Performance Indicator - a measurable value that demonstrates how effectively a company is achieving key business objectives.. The following considerations apply to metric views:
- You can pick your own selection of metrics from any available data sources.
- Raw data is presented in a grid for contrast and comparison of values over a period of time.
- You can create metric views for different levels, such as agent, group, or company.
- Metric views include no calculated scores and no weighting of metrics.
- You can export metric views to different formats.
- You can broadcast and share scorecards with agents and groups through a published dashboard.
NICE Uptivity Performance Management includes some metric views out of the box, but you will probably want to create your own custom views.
The Metric Views page presents you with a list of all views (unless a default view was previously set). You can select a metric view to explore it. If you have View Designer permissions, you can also edit views.
To access Metric Views, go to Performance Explorer.

To explore another view, click Explore / Configure All Metric Views in the top-left corner.

A metric view generated by a scorecard includes the scorecard metrics, the weighted score for each metric on the scorecard, and the overall weighted score metric. If a metric has multiple versions, the view contains all metrics from all scorecard versions. Scorecard views are read-only. For more information, see Balanced Scorecards.