Grid Views
Metric Views enable you to analyze and compare data from a collection of metrics, and are useful for exploring a collection of related KPIs![]() An acronym for Key Performance Indicator - a measurable value that demonstrates how effectively a company is achieving key business objectives..
An acronym for Key Performance Indicator - a measurable value that demonstrates how effectively a company is achieving key business objectives..
For more information, see Metric Views Overview.
When you open a metric view, you have a flexible set of data analysis tools to explore the data in 3 different grids. You can switch between the different grids without losing changes. Clicking the Search tab on the left side allows you to search and filter from any grid.
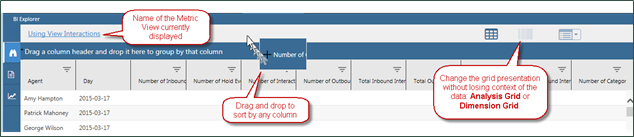
Metric Grid View
The Metric Grid is displayed by default.
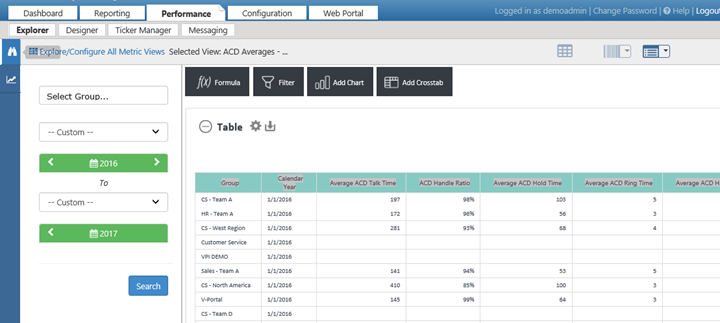
Analysis Grid View
The Analysis Grid presents the view metrics in a table format that you can sort, order, and filter. This grid is similar to a spreadsheet and useful for aggregating data in different ways for further analysis.
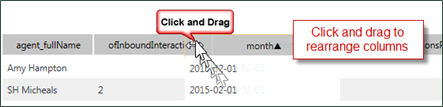
To rearrange columns, drag and drop them in the table.
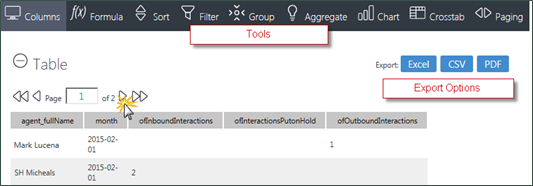
You can export an Analysis Grid to Excel, PDF, or comma-separated values (CSV) formats. You can also save Analysis Grid layouts for later use. For instructions, see Saving an Analysis Grid Layout.
Dimension Grid View
The Dimension Grid provides additional ways to organize data and present it in graphical formats, such as a chart or heatmap. You can export Dimension Grids to Excel format.
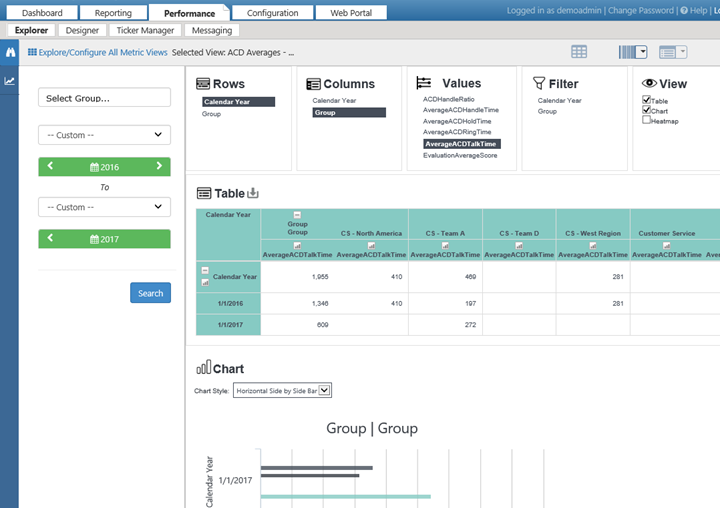
For instructions, see Configuring a Dimension Grid.