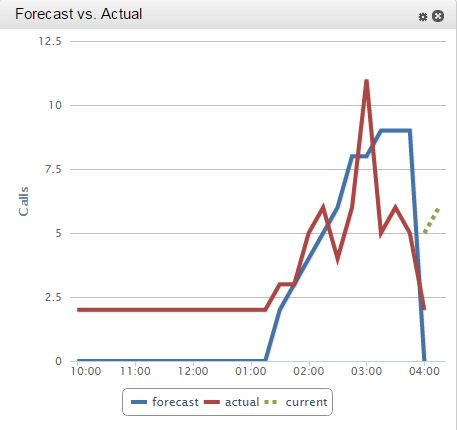
Widget Details: Forecast vs. Actual
The Forecast vs. Actual widget allows users to compare actual call volume against forecast call volume. This widget only contains data in
For more information, see inContact Workforce Optimization Widgets Overview.
Widget Settings
You can name each instance of the widget with a Subtitle relevant to the data it displays. The name can be no more than 100 characters, including spaces and punctuation.
You can filter the data displayed in this widget based on labor unit. You can also use multiple instances of the widget in different dashboards to display data for different labor units. Only the labor units to which you have access will be available in the widget.
Widget Display
The widget displays a line chart showing the current call volume and the forecast call volume over the previous six hours.
