

This help page is for Desktop Studio. This information is also available for Studio.
Required permissions: Applications > Studio > Scripts >
Studio provides two ways you can check for issues in your scripts:
- Check for syntax errors.
- Run a script trace, which shows you what's happening as the script processes each action.
If you have Snippet actions in your script, you can debug the snippet code from within the
Check for Syntax Errors
When you check for syntax errors, any issues found in your script appear in the
Syntax checks happen automatically when you save a script, but you can run a syntax check anytime you want. You won't be able to run or save a script that contains errors. If you attempt to run or save a script that has errors, Studio displays a notification window. You can check the
- Incorrectly spelled variables. For example: Snippet Line 2. Function: NameLabel has not been defined.
- Using a function as a method parameter. For example: Unterminated function parameters.
- Using an incorrect data type in a function that requires a specific data type. For example: Unterminated function parameters.
There are some errors that may not appear on the
Double-click any a warning or error in the
- In Studio, open a script.
- Click Validation > Syntax Check.
- Click the Script Errors tab to view the results of the syntax check.
- Double-click any warning or error on the
Script Traces
You can track the performance of your script, spawn a script, or make a test call with the tool. This tool traces the contact or running script and displays each action that fired, what variables are being created and when, and the values the variables held at each point. This is a helpful tool to test and debug your scripts. You can run traces on live interactions or simulated ones.
You can only capture a trace if the script is saved. If you attempt to capture a script trace on a script with unsaved changes, Studio prompts you to save the script. If you have compile errors in the script, Studio won't save the script. You must resolve errors before you can save the script and run the trace.
Use the Trace Output Window
When you run a trace, the output appears in the ![]() Performs a process within a Studio script, such as collecting customer data or playing music..
Performs a process within a Studio script, such as collecting customer data or playing music..
-
In Studio, open a script and run a trace or open a saved trace file.
 Learn about the fields in this step
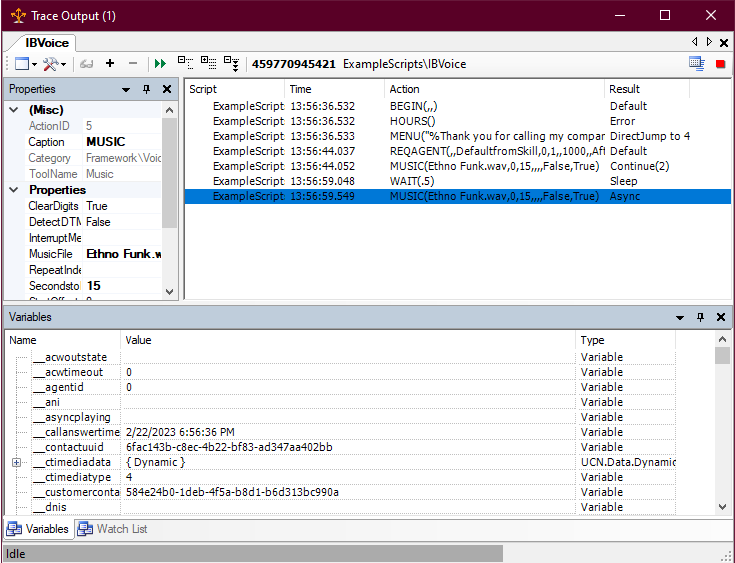
Field Details The name of the script. IBVoice is the name of the script in this example image. Toolbar Under the script name is the
-
 : Change the layout of the
 -
 : Change the variables that are visible in the Variables tab, save the current watch list, and save the current trace to a file on your computer.
 -
 : Create and manage a list of variables you want to watch in this trace.
 -
 : Expand or collapse all actions or variables that have information inside them.
 -
 : This part of the toolbar shows you the contact ID of the current contact. It also shows you the name and path of the script being traced.
You cannot change the location of the toolbar.
Properties When you select an action in the
The default location of the
The
When you click an action, all variables in the script at that point appear in the
The default location of the Script Details pane is on the top right side of the
See the drop-down table in step 2 for information about the column headings in this pane.
When you select a variable in the
The default location of the
You can create a list of script variables that you want to track as the script runs. The variables that you add appear on this tab.
The default location of the
-
-
In the top right of the
Learn more about fields in this step
Field Details The name of the script containing the action. If a main script spawns a subscript, you may see more than one name in the list. The time that the action fired. The name of the action, including the arguments for each. The arguments are all of the configuration settings in the action properties. The outcome of the action firing. This indicates what happened as a result of the script processing action. This may be the branch the script followed or the action that occurred as a result of the action firing.
When the result is Continue, the number in parentheses after Continue indicates the branch that was taken.
For example, in the example image in step 1 of this section, Default and Error are branches. DirectJump to 4 and StartAt ONRELEASE are the outcome of those actions firing. DirectJump to 4 indicates that the contact selected an option in the IVR
Interactive Voice Response. Automated phone menu contacts use via voice or key inputs to obtain information, route an inbound voice call, or both. menu that caused the script to jump to the action with Action ID 4. StartAt ONRELEASE indicates that the script is currently waiting and will restart when an agent answers the interaction. - Click the icons in the toolbar at the top of the
 or collapse all
  of the details for variables in the script details pane. This affects any variable that has additional details within it. These variables are indicated by a + icon next to the name.
 -
Click the Variables tab at the bottom of the window to scroll through all of the variables present in the script when the selected action fired.
Learn more about fields in this step
Field Details The name of the variable. Variables with names that start with two underscore characters are system variables. The value of the variable. This can change as the script progresses from action to action. The type of variable. Options are Variable for standard single-value variables or UCN.Data.Dynamic for dynamic data objects. -
Click the
and select an option to change what variables are displayed in the Learn more about fields in this step
Field Details Select this option if you want global variables to appear in the Show System Variables
Select this option if you want pre-defined system variables to appear in the
Select this option if you want private members to appear in the - On the
- Add variables to a watch list, if you want to track specific variables through the trace.
Change Variable Visibility in a Trace
You can change which sets of variables show in a trace. This allows you to focus on specific kinds of variables, depending on what you're looking for in the trace.
- In Studio, open a script and run a trace.
- In the toolbar of the .
-
Select the option for the variable set you want to view or hide in the trace. Options with a check mark next to them are currently visible in the trace.
Learn more about fields in this step
Field Details Select this option if you want global variables to appear in the Show System Variables
Select this option if you want pre-defined system variables to appear in the
Select this option if you want private members to appear in the
Capture a Script Trace
You can capture a trace on a script as it runs. You can do this with production scripts processing live contacts. This allows you to diagnose issues that your contact center is experiencing, or capture data for troubleshooting with technical support. You can choose to capture a trace on the next instance when the script runs, or you can capture a continuous trace. A continuous trace captures every interaction the script processes. When you capture a single trace, the resulting information appears in the
- In Studio, open the script you want to capture a trace of.
- Click Debug > Capture Script > Next Instance.
- When an interaction starts and the script begins to run, the
Capture a Continuous Script Trace
A continuous trace captures every interaction the script processes. The trace output is saved to files in your NiCE CXone
- In Studio, open the script you want to capture a trace of.
- Click Debug > Capture Script > Continuous. Studio begins to capture all instances of the script running.
View Trace Files
You can view the trace files saved from a continuous trace.
- In Studio, click the Debug menu, then select whether you want to load a trace file that's located on your system or remotely in your NiCE CXone
- Select the file you want to open from the file window that appears.
- Click the button to open the selected trace file. The name varies depending on whether you're opening a local or remote file. The selected file loads in the
- If you want to download trace files from NiCE CXone to your local computer, click the Tools icon in the
Capture a Trace with a Specific ANI or DNIS
You can set a specific ANI![]() Also known as caller ID. Listed phone number of an incoming voice call. or DNIS
Also known as caller ID. Listed phone number of an incoming voice call. or DNIS![]() The number dialed on inbound or outbound voice calls. to fire a trace when a call from the specified number comes into the system.
The number dialed on inbound or outbound voice calls. to fire a trace when a call from the specified number comes into the system.
- In Studio, open the script you want to capture a trace of.
-
In the Studio toolbar, click the Trace Script drop-down and select Trace when ANI is or Trace when DNIS is.
- Enter the ANI or DNIS number you want to trigger the trace in the Insert <number> field.
-
Click the Capture Next Instance icon
 . The number of times you click changes the behavior:
 - Click once to trace the next instance of the script running with the specified number. The icon turns red.
- Click twice to continuously trace future instances of the script running with the specified number. The icon changes into two red circles.
- Click three times to clear the capture. The icon reverts to its original gray color.
- The next time the script runs with the specified ANI or DNIS, a trace is captured and saved to a file.

Watch Variables in a Trace
You can create a list of variables that you are particularly interested in. The watch list allows you to track only these variables without having to search for them in the trace. You can save the list so that each time you run a trace on that particular script, the watch list is saved and loads into the
- In Studio, open the script you want to trace.
- Run an initial trace of the script.
- In the
- For each variable you want to add to the watch list:
- Select the variable on the
- Click the
 .
.
- Select the variable on the
- You can add a variable manually if you know the name:
- In the toolbar of the
- Enter the name of the variable you want to watch and press Enter.
- In the toolbar of the
- If you want to remove a variable from the watch list, select it on the
- To save this watch list, click the Tools icon in the toolbar of the
- When you're ready to watch the variables in your watch list, run a new trace on the script.