Survey Reporting
NICE Uptivity Survey is a separately licensed module that can be integrated with NICE Uptivity. The reports described on this page are only in NICE Uptivity systems that include NICE Uptivity Survey. Survey Reporting is the same in SIP and TDM environments.
NICE Uptivity Survey includes a number of pre-built reports called Printable Reports. You can also use ad hoc reporting functionality to build reports using survey data. You must have appropriate permissions for reporting.
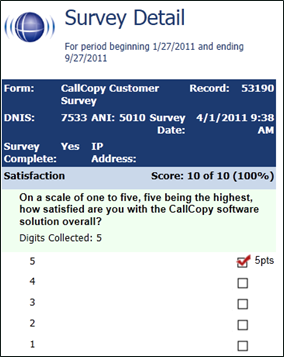
Survey Detail
The Survey Detail report shows complete responses for one or more survey respondent(s) and also provides information about the respondent, such as DNIS![]() An acronym for Dialed Number Indentification Service - A carrier service for 800/888 and 900 numbers that forwards the number dialed by the caller to the number that reaches the agent. and ANI
An acronym for Dialed Number Indentification Service - A carrier service for 800/888 and 900 numbers that forwards the number dialed by the caller to the number that reaches the agent. and ANI![]() An acronym for Automatic Number Identification - ANI is a service of telecommunications carriers, which identifies the telephone number of the calling party. It is commonly used for billing, call routing and database synchronization. There are several specific technologies that fit under the umbrella of ANI, including caller ID.. If respondents left a voice message for a question, a link to the message file appears in the report.
An acronym for Automatic Number Identification - ANI is a service of telecommunications carriers, which identifies the telephone number of the calling party. It is commonly used for billing, call routing and database synchronization. There are several specific technologies that fit under the umbrella of ANI, including caller ID.. If respondents left a voice message for a question, a link to the message file appears in the report.
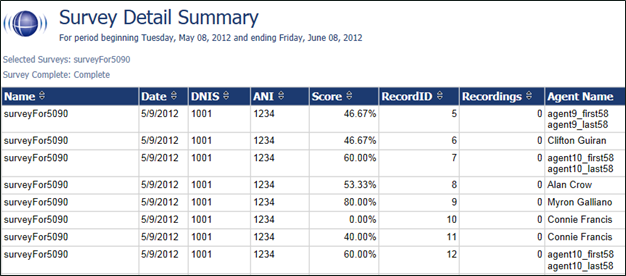
Survey Detail Summary
The Survey Detail Summary lists all survey responses that match the search criteria. Click a survey to open the Survey Detail report for that survey. The Recordings column shows the number, if any, of respondent voice recordings.
Survey Feedback Report
The Survey Feedback Report calculates the shown categories for a specific survey form in a time period. The Survey ID field is required.
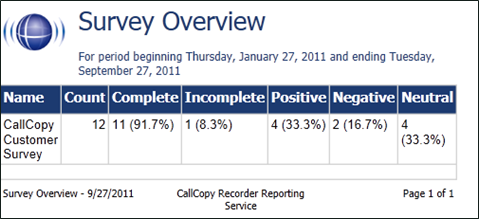
Survey Overview
The Survey Overview report calculates the shown categories for each survey form in a time period. Positive, negative, and neutral ranges are defined on the Uptivity Survey form. If a survey form does not have any responses, it does not appear on the report.
Survey Responses by Group
The Survey Responses by Group report calculates the shown categories for a specific group in a time period. The Group IDs field is required.
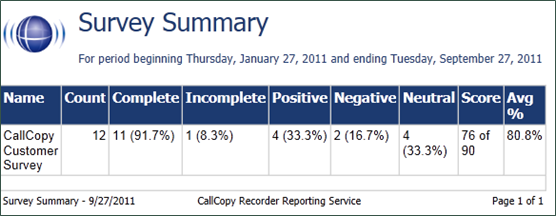
Survey Summary
The Survey Summary report calculates the shown categories for all surveys in a time period, and displays them on a per-survey basis. If a survey form does not have any responses, it does not appear on the report.
- Score — Total score of survey responses and maximum possible score of a survey. The maximum possible score on a survey can vary based on the questions that a respondent is asked to answer. For example, one respondent may be asked to answer five questions with a total of 50 points. Another respondent, based on their answers, will be directed through seven questions with a total of 70 points. This fact must be considered when designing surveys.
- Average Percentage (%) — The sum of each response’s score divided by the sum of the possible score for each form, then divided by the number of responses.
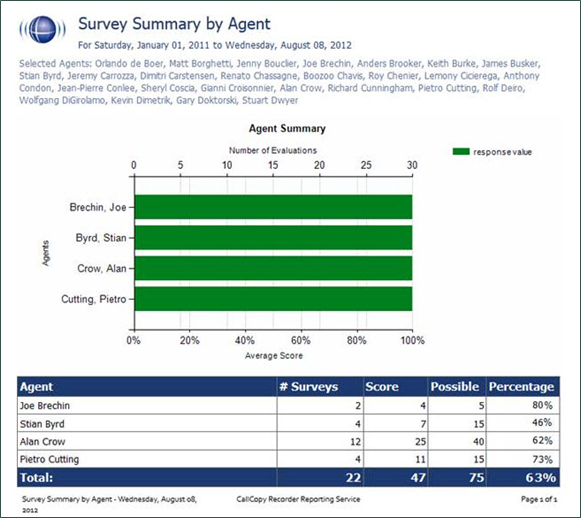
Survey Summary by Agent
Survey Summary by Agent allows you to select a set of agents over a specific date range, and displays the number of surveys completed for each agent, given survey score, total possible points, percentage overall score, and totals for each column.
The Report Type specified determines how results are broken down and displayed:
- Agent — Total scores for all forms by agent
- Form — Scores by form and total scores for all forms for each agent
- Section — Scores for each section on the form
- Question — Scores for each question in each section on each form
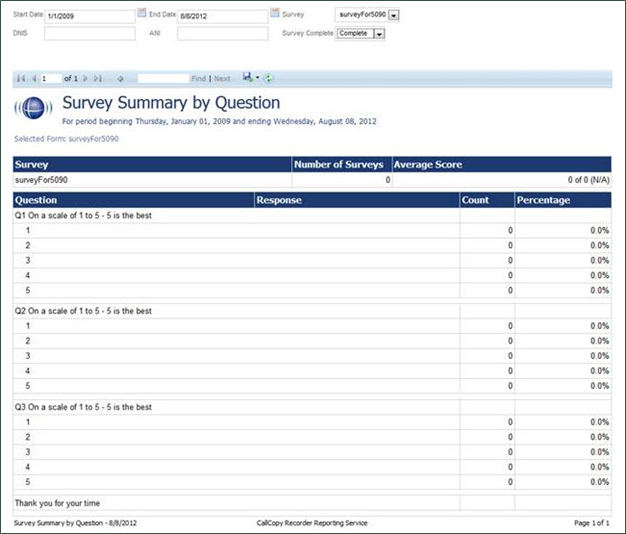
Survey Summary by Question
The Survey Summary by Question report provides a count of each given response to each of the questions in a survey form. You can select a date range, the survey form to evaluate, DNIS/ANI numbers, and survey completion status. For each form evaluated, the generated report displays the number of surveys completed and average score, followed by counts and score percentages for each question in the form. The Survey field is required.
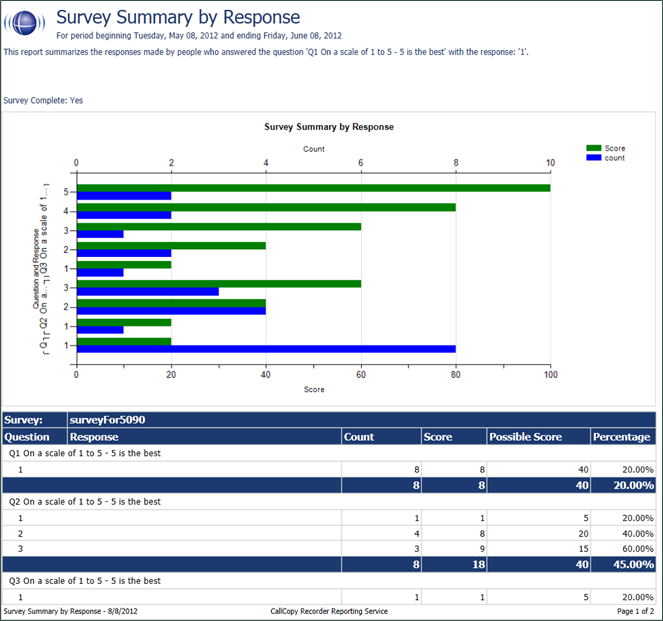
Survey Summary by Response
Survey Summary by Response helps you identify the relationship between a response to one question and the responses to other questions. This allows you to see how different segments of the surveyed population have answered questions. This report works well with surveys where one question addresses a respondent’s overall opinion of a product or service, and follow-up questions elicit the reasons or factors for that overall opinion.
Multiple versions of this report may need to be created in order to identify the relationships between a question’s responses and the responses on the other questions. In other words, if Question 1 has four possible responses, and that question is used as the overall or control question, then a report should be run for each response.
Survey, Question ID, and Response are required fields. The result fields are:
- Count — Number of respondents who selected a response
- Score — Actual total points for a response. If a response was worth two points and three respondents selected it, the Score value would be 6.
- Possible Score — Number of response options multiplied by the point value for a response
- Percentage — The result of Score divided by Possible Score
This report can be run for all questions except Collect Customer Information questions. Because this question type allows customers to leave a recorded voice message as a response, Uptivity Survey cannot include the response in any type of calculation. If you inadvertently include a question of this type as you build this report, NICE Uptivity Survey will not populate the Response field and attempting to run the report generates the error message, "Response value must be selected."
If no respondents selected a response to a question, the response option does not appear on the report.