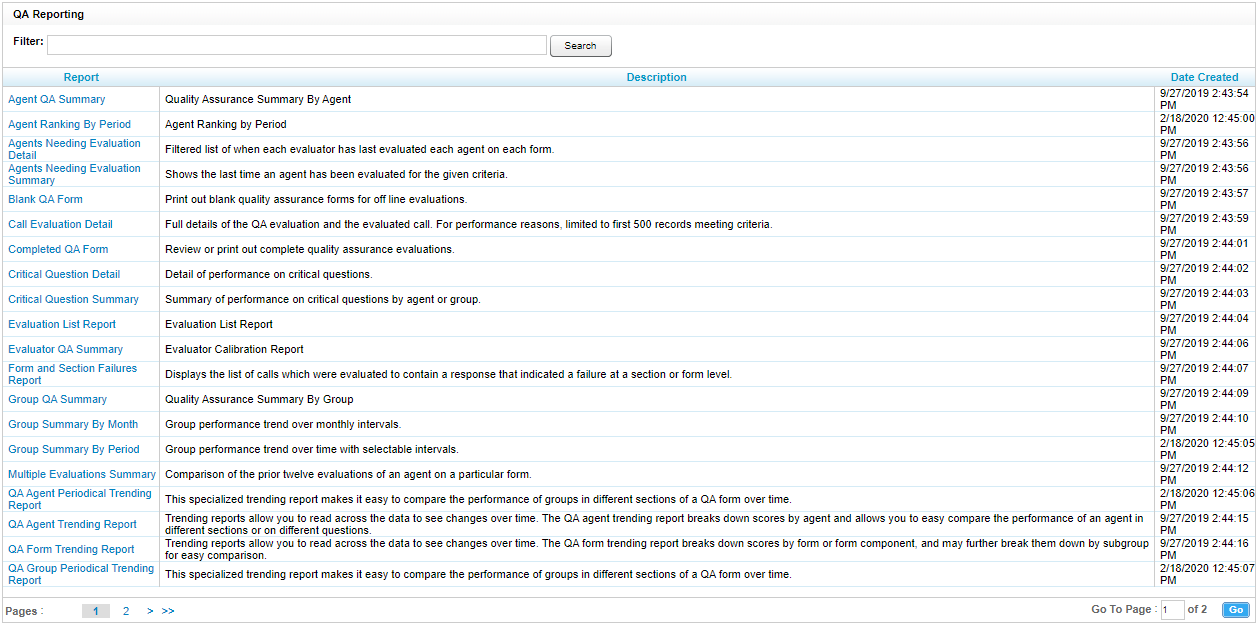
QA Reporting
NICE Uptivity includes a number of pre-built reports called Printable Reports. QA Reports allow you to trend and track the performance of your agents, analysts, and groups as part of your quality management program. The various QA reports give insight into critical areas such as calibration, trending, and team performance. QA reports also serve as extremely powerful coaching tools to help close knowledge gaps, as identified through the evaluation of calls and as shown through reporting.
QA Reporting is based on the evaluations that your quality assurance (QA) team has performed. These reports require that one or more QA evaluation forms be created. The way that forms are created affects and impacts the reporting data you are able to see in this category of reports.
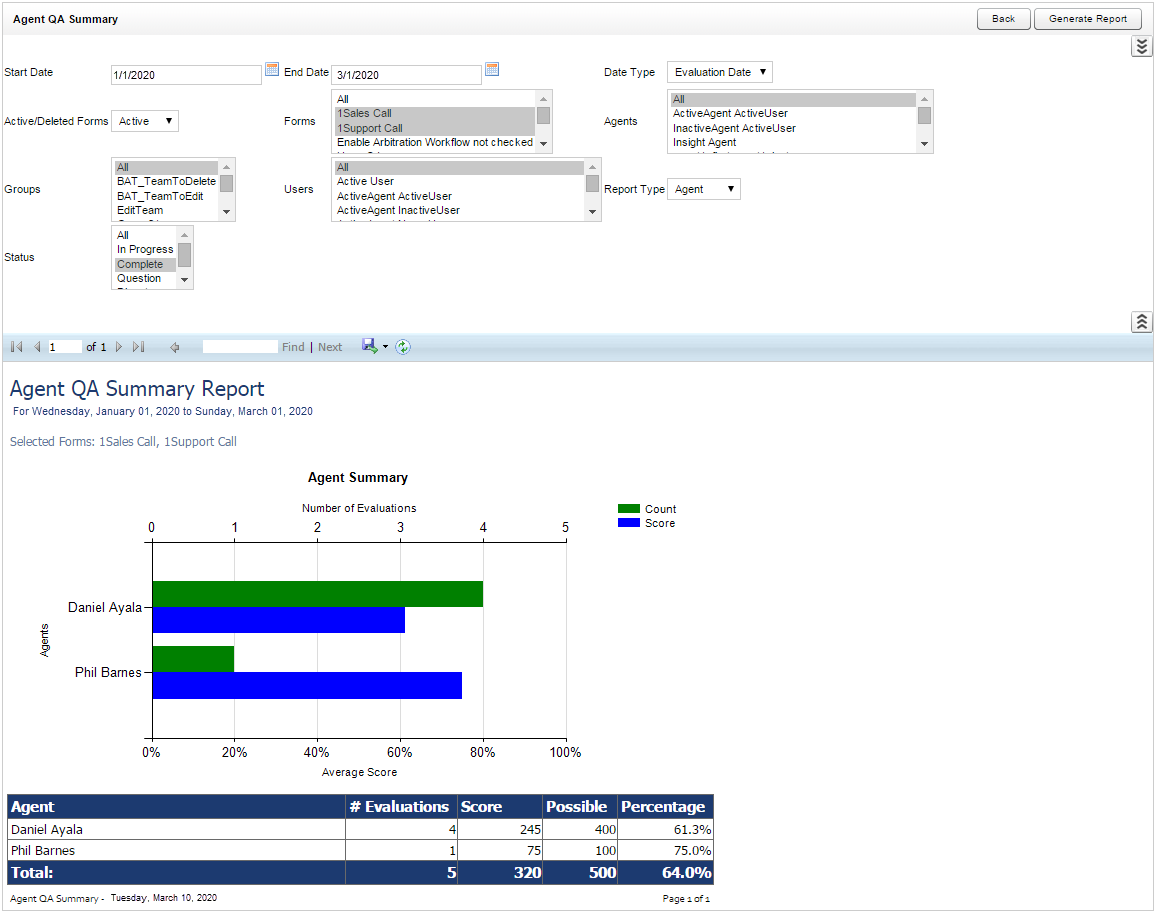
Agent QA Summary
The Agent QA Summary displays the QA performance of selected Group(s)![]() A definable collection of users. or Agent(s)
A definable collection of users. or Agent(s)![]() The person or people taking the inbound calls. over a period of time. The Report Type criteria item lets you specify the level of detail: Agent, Form, Section, or Question. When you view the report onscreen, you can drill down to lower levels of detail.
The person or people taking the inbound calls. over a period of time. The Report Type criteria item lets you specify the level of detail: Agent, Form, Section, or Question. When you view the report onscreen, you can drill down to lower levels of detail.
You must select a Status to run this report.
In the following image, Report Type was set to Agent, and you can drill down to section-level or question-level results by clicking the agent’s name. Report results are limited to groups to which you have access, even if you select All.
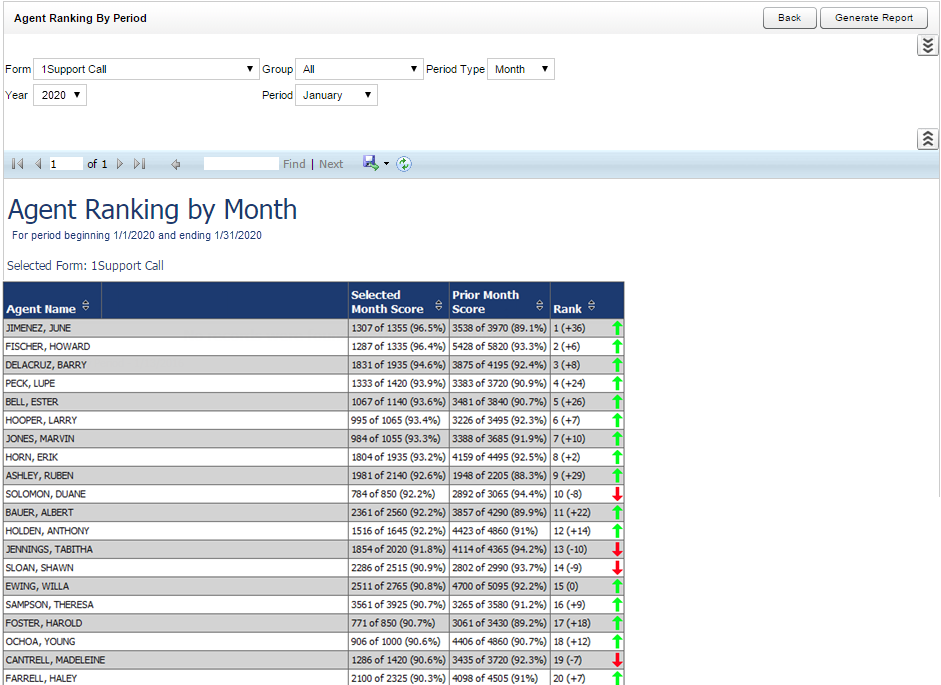
Agent Ranking by Period
The Agent Ranking by Period report compares an agent's QA performance from one time period to another: week to week, month to month, quarter to quarter, or year to year. The last column in the report ranks agents in your system from 1–X. Positive trending is shown with a green arrow and negative trending with a red arrow. Report results are limited to groups to which you have access, even if you select All.
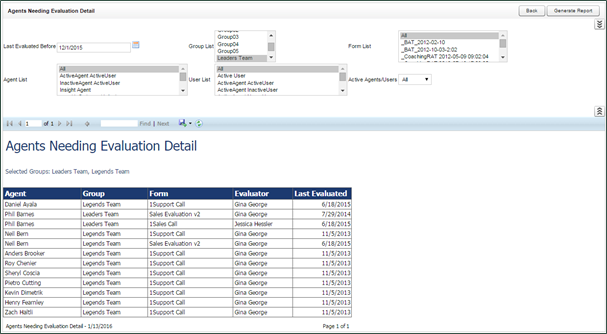
Agents Needing Evaluation Detail
The Agents Needing Evaluation Detail report helps you determine agents who may be due for evaluation. The report displays the Agent name, all Uptivity Group(s) to which they belong, any Forms associated with those groups, any possible Users who could serve as Evaluator, and the date the agent was Last Evaluated. You can filter results by any of these displayed items, as well as by whether agents are Active or Inactive and by a Last Evaluated Before date. Report results are limited to groups to which you have access, even if you select All.
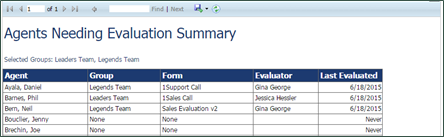
Agents Needing Evaluation Summary
The Agents Needing Evaluation Summary displays the same information as the Agents Needing Evaluation Detail report, but only shows one entry per agent regardless of the number of Uptivity Groups to which they belong. It offers the same criteria choices. Report results are limited to groups to which you have access, even if you select All.
Blank QA Form
The Blank QA Form report displays a blank version of a specific QA evaluation form.
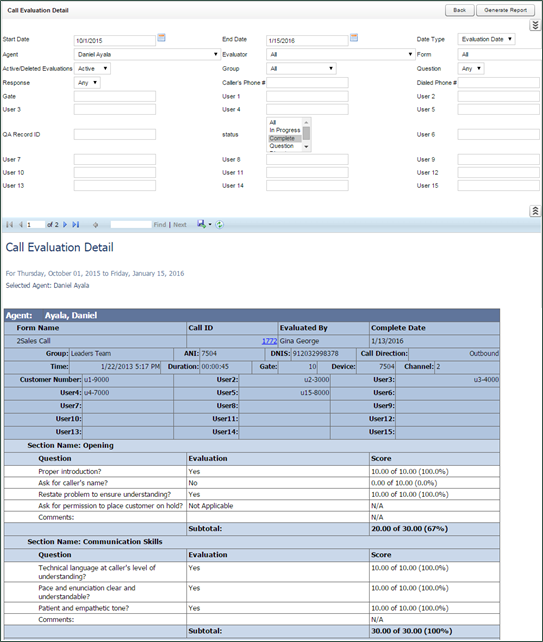
Call Evaluation Detail
The Call Evaluation Detail report shows detailed results on a completed QA evaluation based on your selection criteria. Metadata information is shown at the top, followed by a section- and question-level breakdown of the form with individual responses. Report results are limited to groups to which you have access, even if you select All.
You must select a Status to run this report.
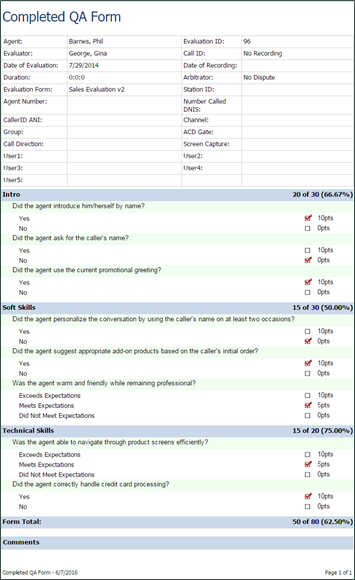
Completed QA Form
The Completed QA Form report displays scoring data for a specific QA evaluation. The report shows both earned and possible points for each question so that agents and evaluators can more clearly see areas for improvement. The report is automatically generated when you print a QA Record via Search QA Evaluations, and is rarely printed from the Reporting tab because you must know the QA Record ID to generate the report. Report results are limited to groups to which you have access. All comments by agents, evaluators, and arbitrators appear at the bottom of the report.
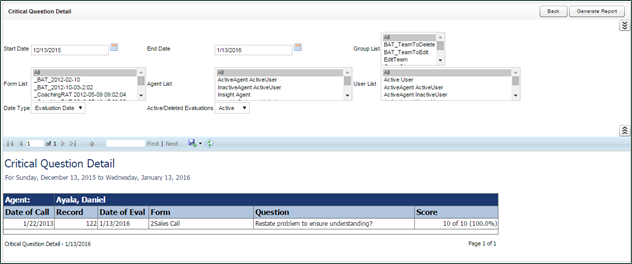
Critical Question Detail
The Critical Question Detail report provides detailed insight as to how each agent has scored on Critical questions on the forms you specify across a period of time. The report shows a line for every evaluation that included a Critical question. Report results are limited to groups to which you have access, even if you select All.
Critical Question Summary
The Critical Question Summary is similar to the Detail version, but shows a summary of per form. For example, suppose an agent was evaluated five times using one form with a Critical question and four times using another form with a different Critical question. The Detail report would show a line for each of the nine evaluations. The Summary report would show one line for the form used five times and one line for the form used four times. Report results are limited to groups to which you have access, even if you select All.
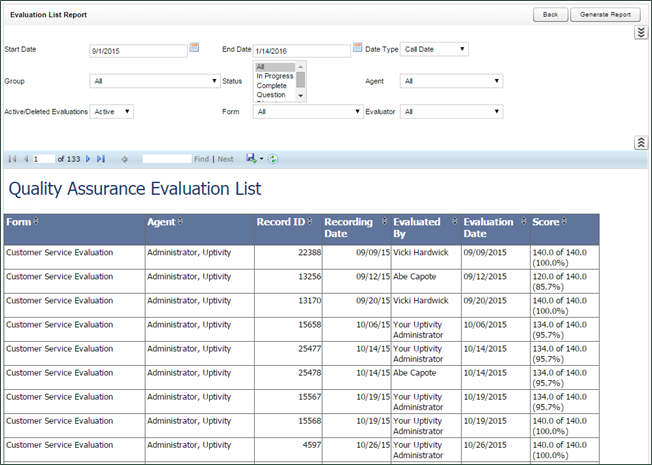
Evaluation List Report
The Evaluation List Report generates a list of standard QA evaluations performed within the specified time period. Self-evaluations and calibration evaluations are not included. The report provides a means of tracking the evaluation process and the scoring of evaluations. Report results are limited to groups to which you have access, even if you select All.
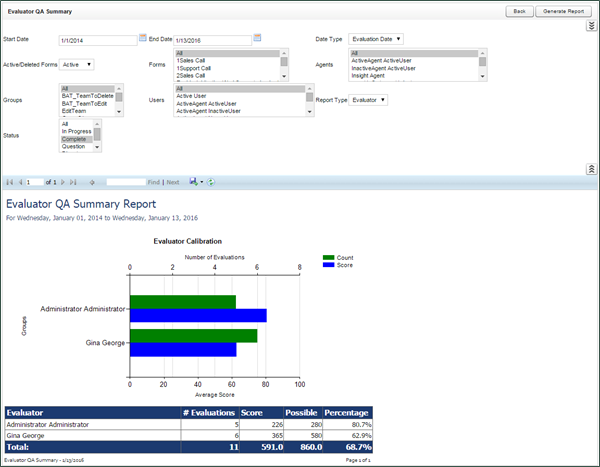
Evaluator QA Summary
The Evaluator QA Summary displays results of one or more evaluator's QA performance over a selected period of time. It can be used to compare scoring practices among evaluators, and help determine when it might be appropriate to have evaluators perform a calibration evaluation. The initially-generated report is a high-level comparison, but you can drill down for more granular detail.
You must select a Status to run this report.
Report results are limited to groups to which you have access, even if you select All.
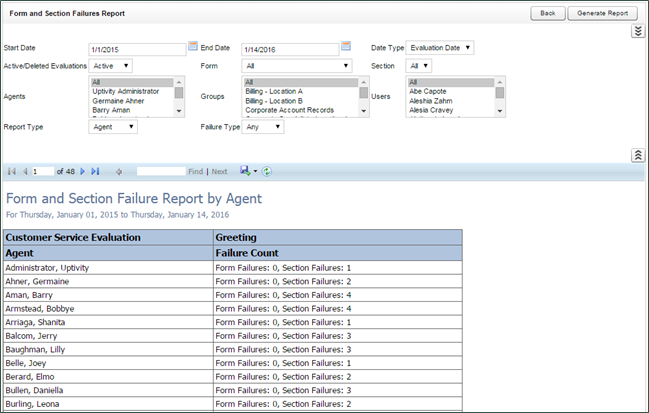
Form and Section Failures Report
The Form and Section Failures Report displays failure points in one or more forms over a selected period of time. The top section shows a summary of the total number of form failures and section failures per agent; the lower section supplies the detail of the failure(s). Report results are limited to groups to which you have access, even if you select All.
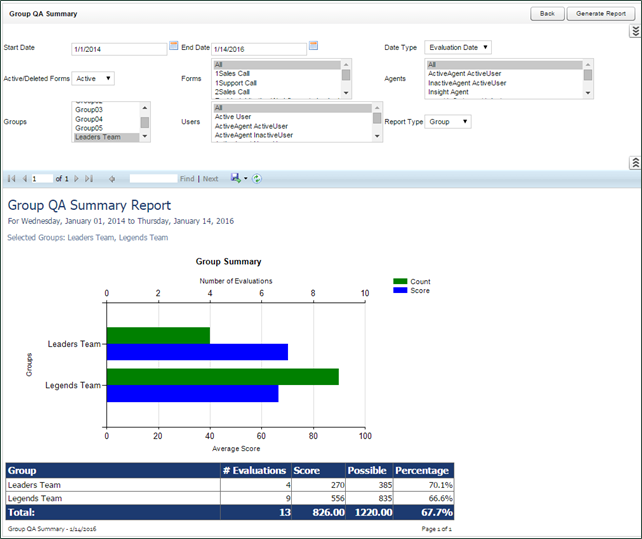
Group QA Summary
The Group QA Summary displays performance of one or more group(s) on one or more form(s) over a period of time. You can drill down for more granular data on Report Type (Group, Form, Section, or Question). Report results are limited to groups to which you have access, even if you select All.
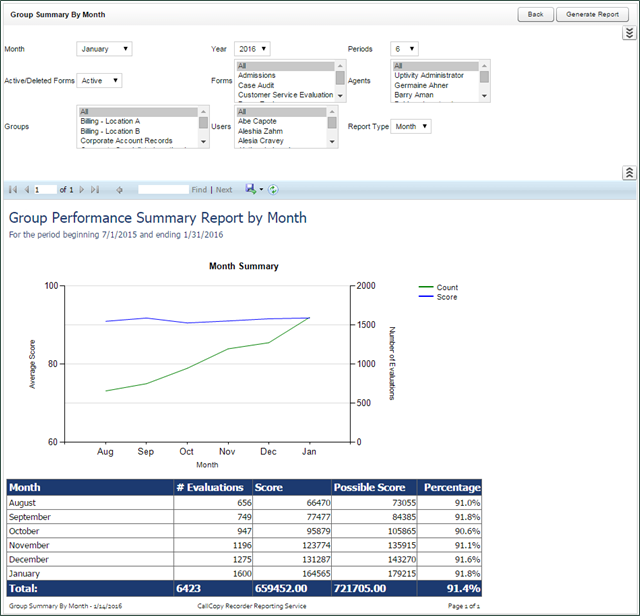
Group Summary by Month
The Group Summary by Month report displays performance of one or more team(s) on one or more form(s), charted over a certain number of months based on the end Month you select. Choosing a Report Type of Month shows total data for each month. Choosing a Report Type of Group shows evaluation data by QA Group for each month. Report results are limited to groups to which you have access, even if you select All.
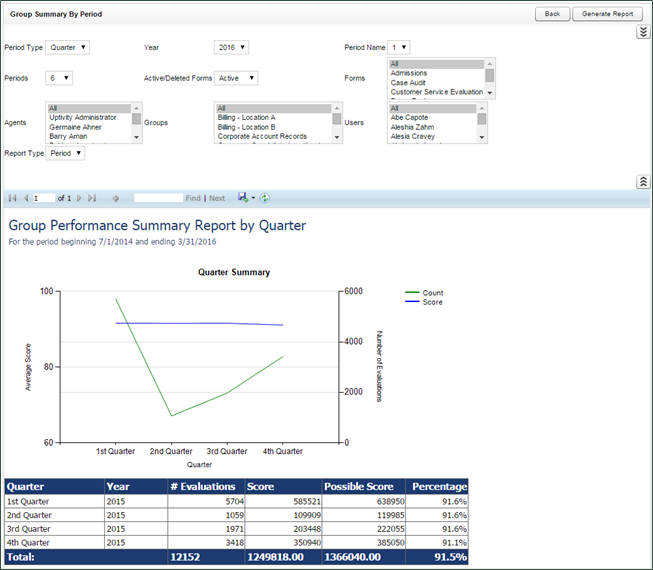
Group Summary by Period
The Group Summary by Period report displays performance of one or more team(s) on one or more form(s), charted over a certain number of Periods (week, month, quarter, or year). This time period begins with the date or period selected in the Period Name field and looks backward over the specified number of periods. Report results are limited to groups to which you have access, even if you select All.
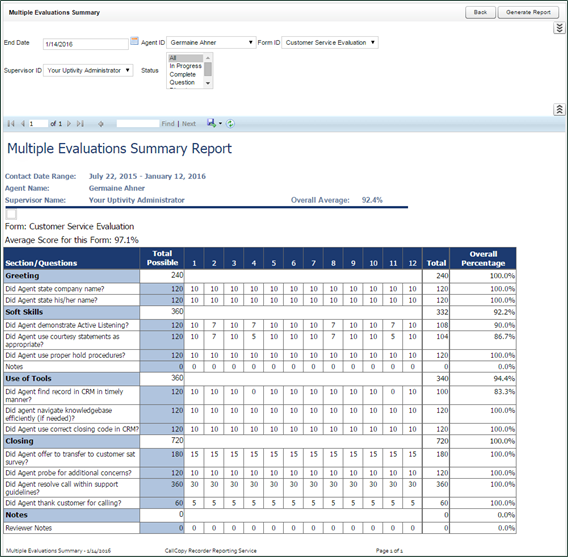
Multiple Evaluations Summary
The Multiple Evaluations Summary displays the last 12 evaluations conducted on a selected agent and form, based on a selected end date. Overall Average % is the average score of all evaluations done using the selected form regardless of agent or evaluator. Average Score for this Form % is the total average of the last 12 evaluations performed using the selected form, by the selected evaluator, for the selected agent. Individual percentages in the Overall Percentage column are Section totals. Individual question Totals are for the last 12 evaluations performed on the selected form, by the selected evaluator, for the selected agent.
You must select an Agent ID, Form ID, Supervisor ID, and Status to run this report.
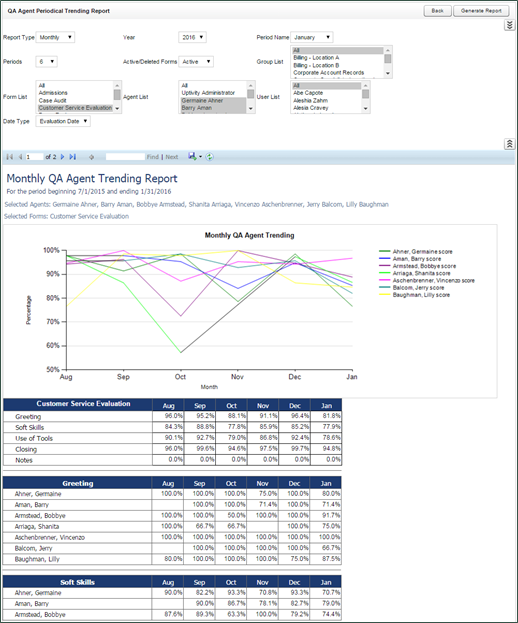
QA Agent Periodical Trending Report
The QA Agent Periodical Trending Report summarizes an agent's performance over a selected period of time. This time period begins with the date or period selected in the Period Name field and looks backward over the specified number of periods. The reporting period can be daily, weekly, monthly, quarterly or yearly
Performance can be shown on a per-form basis as well as for selected agents, groups, or users. Report results are limited to groups to which you have access, even if you select All.
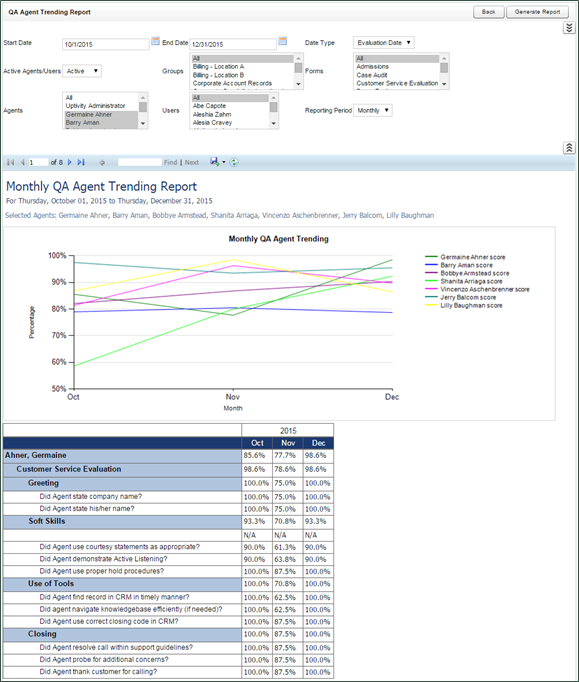
QA Agent Trending Report
The QA Agent Trending Report summarizes an agent's performance on a particular form over a period of time. Performance can be broken down on a section-by-section, and question-by-question basis, depending on how the QA evaluation form was created. Report results are limited to groups to which you have access, even if you select All.
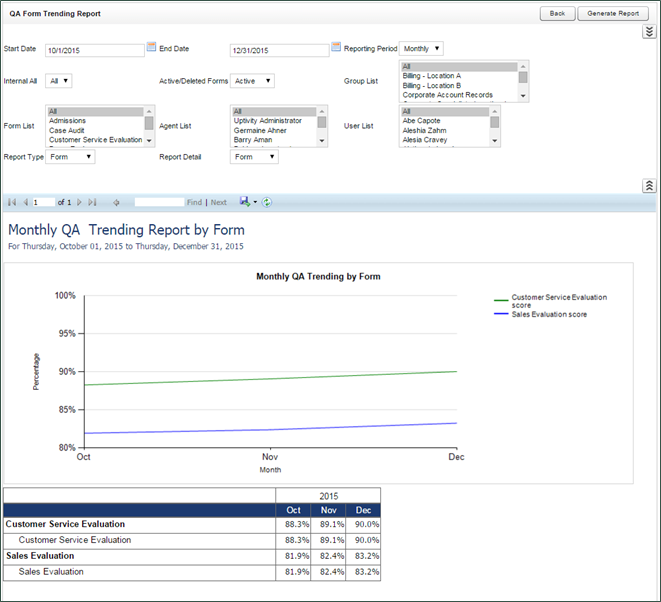
QA Form Trending Report
The QA Form Trending Report displays total quality performance on a particular QA evaluation form over a period of time.
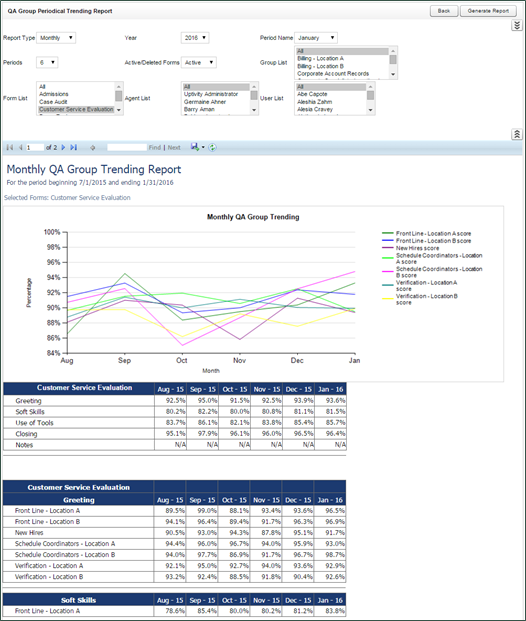
QA Group Periodical Trending Report
The QA Group Periodical Trending Report displays performance of one or more group(s) on one or more form(s) over a period of time. This time period begins with the date or period selected in the Period Name field and looks backward over the specified number of periods. The reporting period can be daily, weekly, monthly, quarterly or yearly. The first table shows the average monthly score for all selected groups on each section of the evaluation. The second table shows the average monthly score for each group individually on each section of the evaluation.
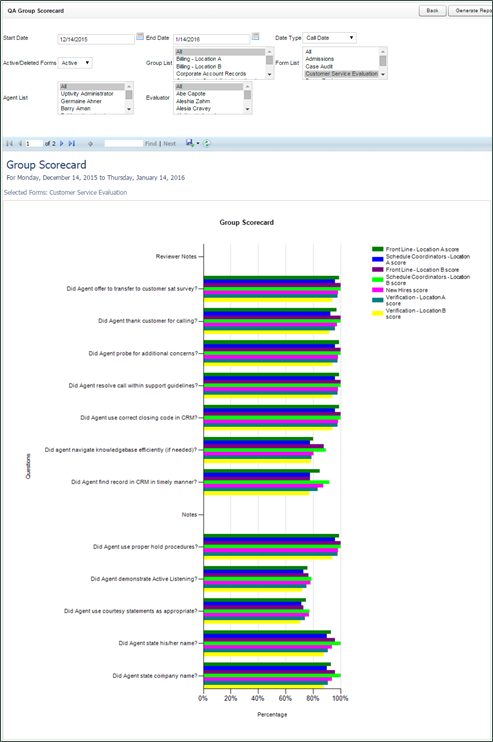
QA Group Scorecard
The QA Group Scorecard displays a group-by-group comparison of results for a QA evaluation form, at a question level, based on a period of time.
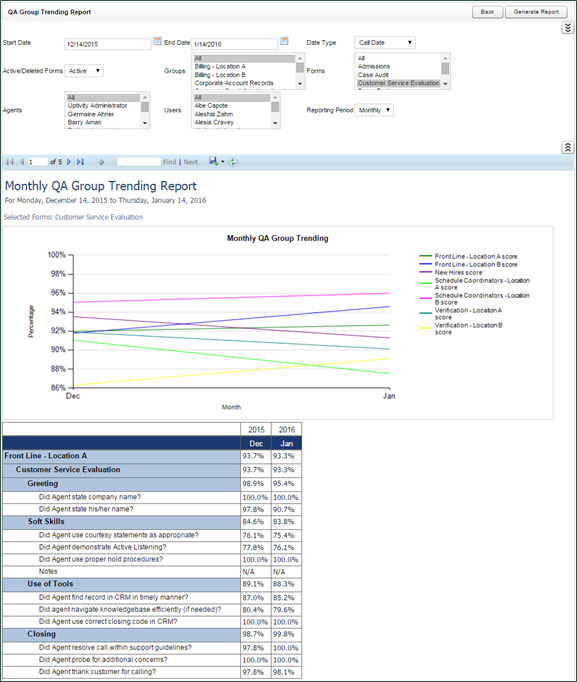
QA Group Trending Report
The QA Group Trending Report displays a group-by-group comparison of results for a QA form, at a per-question level. Data is compared daily, weekly, monthly, or yearly based on your selections for a specific period of time.
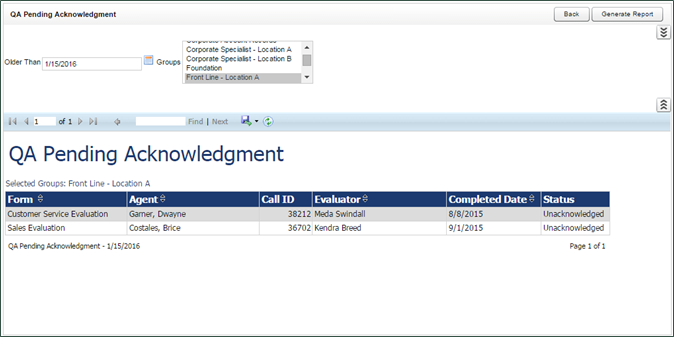
QA Pending Acknowledgement
The QA Pending Acknowledgment report displays a list of unacknowledged QA evaluations on an agent-by-agent and form-by-form basis. This report is only needed if you use the acknowledgment-only or acknowledgment and arbitration workflows.
You must select a Group to run this report.
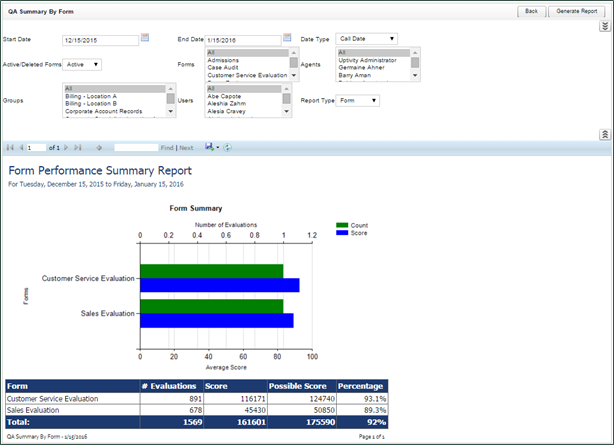
QA Summary by Form
The QA Summary by Form report displays performance on one or more QA evaluation forms over a period of time. You can drill down into the report for additional details.
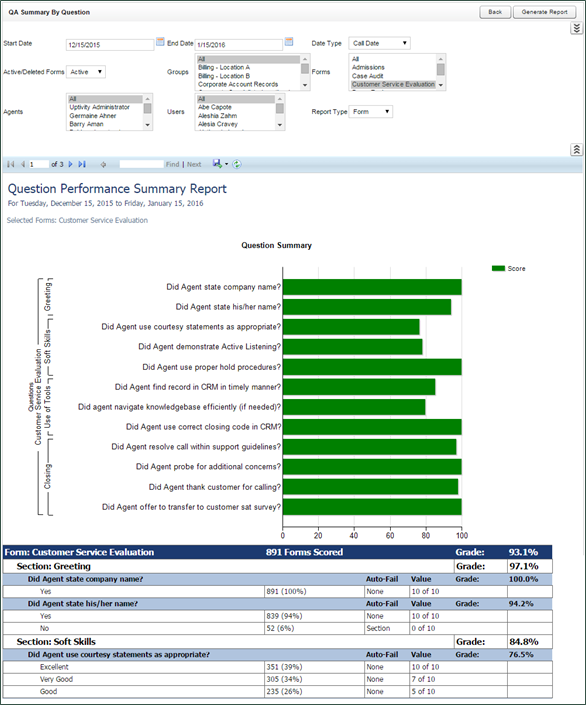
QA Summary by Question
The QA Summary by Question report displays performance on a QA evaluation form's individual questions over a period of time. Information is shown in graphical and text format.
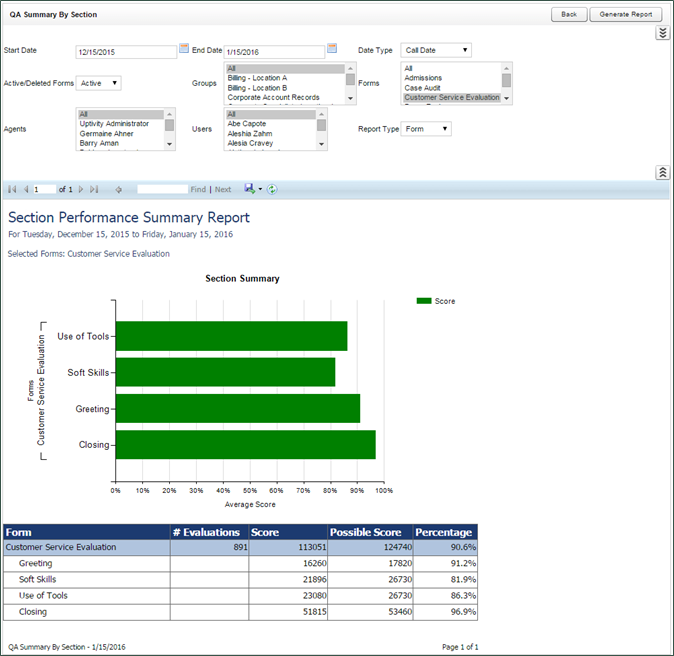
QA Summary by Section
The QA Summary by Section report displays performance on a QA evaluation form's sections over a period of time. You can drill down into the report for additional details.
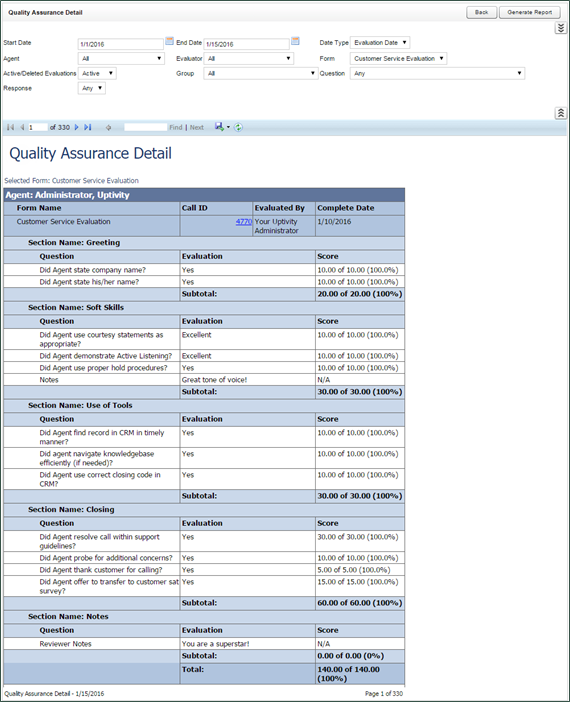
Quality Assurance Detail
The Quality Assurance Detail report shows completed QA evaluations that meet the criteria you provide. The specific call graded in the evaluation can be played back by clicking on the Call ID hyperlink. This hyperlink functionality does not work in exported versions of the report.
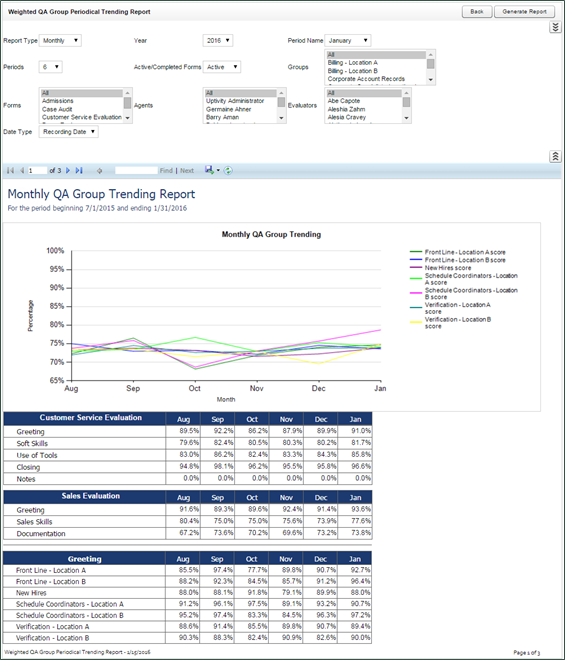
Weighted QA Group Periodical Trending Report
The Weighted QA Group Periodical Trending Report displays group-by-group comparisons of quality results at the section level of a form over a period of time. This time period begins with the date or period selected for Period Name and looks backward over the specified number of periods. The reporting period can be daily, weekly, monthly, quarterly or yearly. Data is broken down section by section.