Adding a Chart to UCCX Reports
Overview
Cisco UCCX reports offer the ability to add charts for graphical representation of the data.
For more information, see Cisco UCCX Reports.
To add a chart to a UCCX report:
- From the Report Library or My Reports widget, click the report you want to run.
- Click the Filter icon (designated by a funnel) to open the Filters Panel.
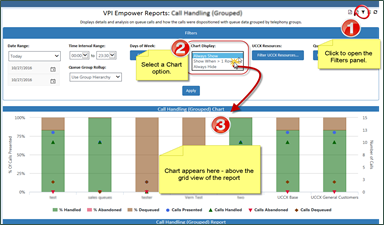
- Select a Chart Display option.