Displaying Scorecards
You may periodically review your scorecards and decide to change what you are measuring, set different goals, or adjust the weighting for promotions or historically busy periods. You can see and view all scorecard versions in the Scorecard Explorer.
For more information, see Published Scorecards Overview.
Scorecard Explorer
Use the Scorecard Explorer to view scorecards for multiple agents or groups at once, to view trending for a scorecard, or both. A scorecard is only calculated for the people and time periods for which it is configured. To access the Scorecard Explorer, click the graph icon in the left panel of the Explorer.
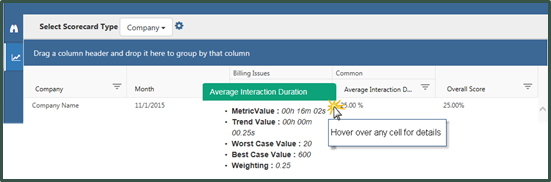
The Select Scorecard Type field in the Scorecard Explorer enables you to filter the type of scorecards displayed by Agent, Group, or Company. If you filter by agent, you can further filter for specific agents, or agents in specific groups. If you filter by group, you can filter for specific groups based on your permissions. The Group filter also tells you how many agents you selected.
When you click the Scorecard drop-down, a search field appears that allows you to search existing scorecards based on their attributes, such as title, metrics, description, and so forth.
You can drag and drop scorecard rows to compare them, and you can hover over any cell in a scorecard to see additional detail about the value, configuration, and score. For more information on the elements of a scorecard viewed in the Scorecard Explorer, see Balanced Scorecard Elements.
Metric View
Use the Performance Tab to view scorecards for multiple agents or groups with goals.
The numbers on the image below highlight different sections of this view. The list below the image describes each section.
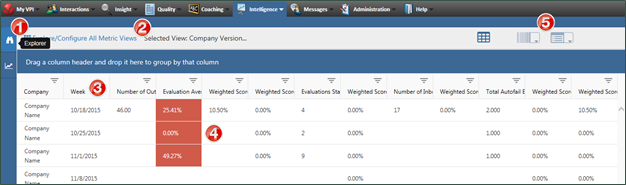
- Metric View Explorer tab of the Performance Tab.
- Name or selected view, including version.
- Calculated period.
- Goal - Cell color indicates performance against a defined goal.
- View format buttons - Click to toggle between Metric Grid, Analysis Grid, and Dimension Grid.
Dashboard
You have two options for putting a scorecard on the dashboard: the Scorecard widget and the Metric View widget. Scorecard widgets are best used to view single agents or groups, to see goals, to see trending, or any combination of these. Metric view widgets should be used to view scorecards for multiple agents or groups with goals.
The numbers on the image below highlight different sections of this view. The list below the image describes each section.
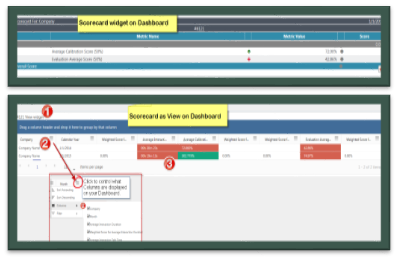
- Name of scorecard.
- Sort / filter by columns.
- Cell color indicates performance against a defined goal.
In a scorecard widget, you can hover over a cell to see additional information. Details include the metric value, trend value (the metric value from the “trend against” period), worst and best case values, and weighting. Scorecards present the goal and trend of the score (as opposed to the base value of the metric).
Remember that scorecards are calculated for select agents and groups as defined in the Scorecard Designer. When no data is presented, it means that the scorecard has not been configured to calculate the user or group.