Understanding Uptivity Error Messages
For a PDF version of this information, click here.
Error Message Overview
Uptivity can be configured to notify you when issues require your attention. Issues are logged according to severity, and you can choose the level at which notifications are sent.
This
This
For detailed information on configuring log levels and alerts,
How Can This Topic Help ?
Step One
Review the sample emails in the Anatomy of an Uptivity Alert section to become familiar with the way alerts are structured.
Step Two
When you receive an email alert from your Uptivity system, determine which application sent the message. Then review the Services Overview to see how that service affects your system.
Step Three
Check the Logging Type in the email alert. Then look at the type in the Logging Levels topic and take the appropriate action.
Anatomy of an Uptivity Alert
Email alerts sent by Uptivity pull information directly from the application logs and can be a bit challenging if you are not used to reading log data. Consider the following examples and explanations from Premises systems.
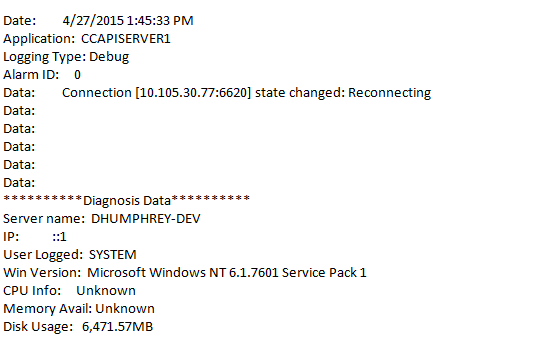
This example contains the following information:
- Date — The date and time the log entry was created.
- Application — The module or component within Uptivity that generated the log entry. In this case, the module was an API Server service named CCAPISERVER1. For more information, see Services Overview.
- Logging Type — The severity level of the event. In this case, the level was Debug. For more information, see Logging Levels.
- Alarm ID — This field is not currently used by Uptivity; you may disregard it.
- Data — Description of the actual event. In this case, the state of the application changed to "Reconnecting."
- Diagnosis Data — This section provides details regarding the status of the server at the time the event occurred. For example, you can see the name of the logged-in user, disk usage, and so forth. This may or may not be useful, depending on the type of event.
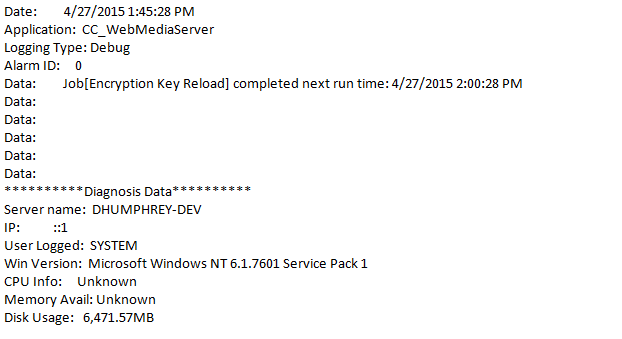
In this example, a Web Media Server service named CC_WebMediaServer generated a Debug level log entry at 1:45 PM on April 27, 2015, when it reloaded an encryption key.
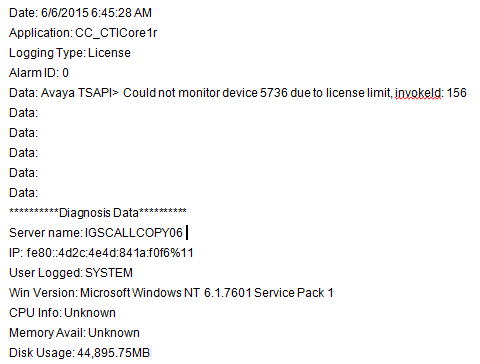
In this example, a CTI Core service named CC_CTICore1r generated a License level log entry at 6:45:28 AM on June 6, 2015. The module was unable to monitor device 5736 because there were no Avaya TSAPI licenses available. This error would only be seen in an Avaya TSAPI environment.