

A reporting widget is a module of focused data that you can display on your dashboard. These provide a quick view of both real-time and historical data for your contact center. Widgets help track things like agent performance, estimated service level (SLA), or administrative data for skills, queues, unavailable states, and so forth. You can use multiple widgets to help keep your contact center running smoothly and efficiently throughout the day.
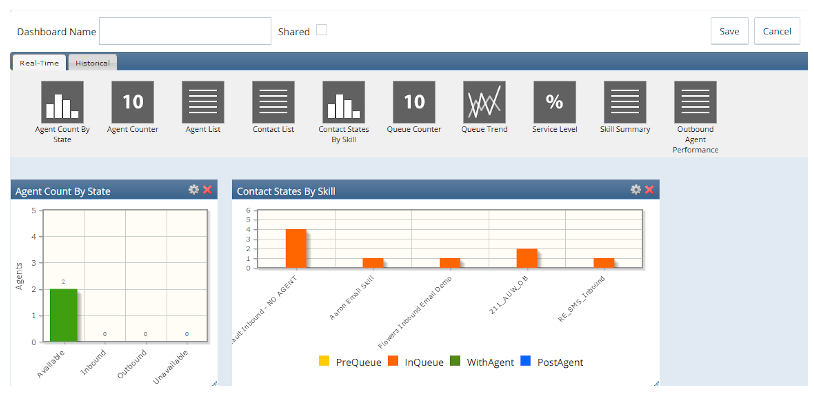
The following image shows a dashboard being edited to add widgets. You can see the Real-Time and Historical tabs at the top, along with two example widgets already on the dashboard (Agent Count By State and Contact States By Skill). The Agent Count By State widget displays the number of agents logged in and their current state (available, unavailable, and so forth). The two widgets below have a settings cog and red X in the upper-right corner. These allow you to configure the widget settings or remove the widget from the dashboard. These two options are available when editing the dashboard.
Key Facts About Widgets
- You can add widgets to a dashboard by editing the dashboard, then dragging and dropping widgets into your desired position.
- When adding widgets to a dashboard, Real-Time and Historical widgets are categorized into separate tabs.
- You can configure the widget settings or remove it from the dashboard when editing the dashboard. In the settings, you can determine parameters for the displayed data, such as a time range or specific skills.
- Widgets have a refresh rate, which is the frequency at which the widget is updated with new data. Widgets do not all have the same refresh rate, however the most common rates are several seconds or several minutes.
- The Refresh button at the top of the dashboard updates all widgets with the most up-to-date data. Some widgets also offer a refresh button next to the print icon to individually refresh the data for that specific widget.
- You can resize widgets on the dashboard by clicking and dragging the bottom-right corner.
- You can print displayed data from a widget by pressing the Print button in the top-right corner of the widget.
- Some widgets allow you to export the displayed data. If a widget supports this functionality, an actions button displays next to the printer button. You can export data in the following formats: Excel, CSV, PDF.