

Required Permissions:
Filter and View Calls
Filtering calls lets you sift through all your calls and find only segments with quality issues. This helps you quickly find a specific call, or peruse all calls with issues. When you refresh the page, your filter and sort options are saved. If you leave the page and return later, you need to make your selections again.
- Click the app selector
 and select Monitoring Gateway.
 -
Click Voice Quality Metrics.
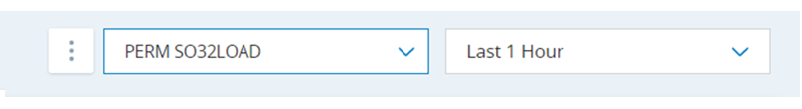
- From the load criteria on the top-right, select the
 High-level organizational grouping used to manage technical support, billing, and global settings for your NiCE CXone system.
 -
Use the global filter
 to specify which types of calls you want to query from the database. Learn more about the fields in the filter
Field Details Agent The name of the agent who handled the call.
You can filter calls based on agent name.
You can display this field as a column in the call list.
Agent Name The name of the agent who handled the call.
You can filter calls based on agent name.
This data displays in the Call Details tab of the contact record.
Agent ID The ID of the agent involved in the call.
You can filter calls based on agent ID.
You can display this field as a column in the call list.
This data displays in the Call Details tab of the contact record.
Agent Console Type The console used by the agent to view and edit multiple records in a call.
This is available for MAX only.
This data displays in the Call Details tab of the contact record.
Agent Console Version The version of the agent console.
This data displays in the Call Details tab of the contact record.
AgentLegDefault The traffic destined for agents, including agent-to-agent transfers. Associated Contact ID The contact ID
A unique numerical identifier assigned to each contact. assigned to a call after a transfer. It remains associated with the call's previous contact ID (the Master Contact ID The master or parent ID for one or more related contacts. A new master contact ID is assigned if a contact is transferred three or more times.).This data displays in the Associated Contacts tab of the contact record.
Average Bit rate (kbps) The average bit rate of the call.
You can filter calls based on average their bit rate. Use the sliders to select the minimum and maximum amounts of bit rate that you want to use as a filter.
This data displays in the Call Details tab of the contact record.
Average Jitter (ms)
The average amount of jitter during the call, in milliseconds.
You can filter calls based on average jitter. Use the sliders to select the minimum and maximum amounts of jitter that you want to use as a filter.
You can display this field as a column in the call list.
This data displays in the Call Details tab of the contact record.
Average MOS Score The average mean opinion score (MOS) of the call.
You can filter calls based on average MOS. Use the sliders to select the minimum and maximum average MOS that you want to use as a filter.
You can display this field as a column in the call list.
This data displays in the Quality Details tab of the contact record.
Average Packet Loss (%) The average percentage of packet loss during the call
You can filter calls based on average package loss. Use the sliders to select the minimum and maximum amounts of packet loss that you want to use as a filter.
You can display this field as a column in the call list.
This data displays in the Quality Details tab of the contact record.
Average R-Factor The average R-factor for the call.
You can filter calls based on average R-factor. Use the sliders to select the minimum and maximum R-factor score that you want to use as a filter.
You can display this field as a column in the call list.
This data displays in the Quality Details tab of the contact record.
Average RTT (ms) The average amount of data packets transferred per round-trip time in milliseconds.
You can filter calls based on average RTT. Use the sliders to select the minimum and maximum amounts of RTT that you want to use as a filter.
This data displays in the Quality Details tab of the contact record.
Browser The browser used at the time of the call.
This data displays in the Call Details tab of the contact record.
BU ID The ID number of the
High-level organizational grouping used to manage technical support, billing, and global settings for your NiCE CXone system.This data displays in the Call Details tab of the contact record.
BU Name The name of the
This data displays in the Call Details tab of the contact record.
Business Unit The
You can display this field as a column in the call list.
Call Duration The length of the call (in seconds).
This data displays in the Call Details tab of the contact record.
Call ID The ID number of the call.
This data displays in the Call Details tab of the contact record.
Call Score The score of the call, which is calculated based on its mean opinion score (MOS).
You can filter calls based on call score.
You can display this field as a column in the call list.
This data displays in the Quality Details tab of the contact record.
Cluster The cluster ID where the
This data displays in the Call Details tab of the contact record.
Contact ID The ID of the customer involved in the call.
You can filter calls based on contact ID.
You can display this field as a column in the call list.
This data displays in the Quality Details tab of the contact record.
NiCE CXone Network The average voice quality for call flow within NiCE CXone network (for example, call flow between NiCE CXone media servers and NiCE CXone SBCs). This only appears for SIP Protocol used for signaling and controlling multimedia communication sessions such as voice and video calls. calls or non-WebRTC protocols.DB Key A unique call identifier. All correlated contact IDs share the same DB key.
You can filter calls based on the DB key.
You can display this field as a column in the call list.
This data displays in the Call Details tab of the contact record.
DefaultOutbound The outbound public switched telephone network (PSTN) destined calls. Direction The call type, which can indicate the direction of the call. For example, InboundToAgent, ManualAgentOutbound, or BlindXfer.
You can filter calls based on call direction.
You can display this field as a column in the call list.
This data displays in the Call Details tab of the contact record.
Disconnect Reason The reason the call disconnected.
This data displays in the Call Details tab of the contact record.
Disconnect Time (sec) The amount of time (in seconds) that it took the call to disconnect after the customer or agent hung up.
This data displays in the Call Details tab of the contact record.
Disposition The disposition
Result assigned by the agent or system at the end of a voice (disposition) or digital (status) interaction. assigned to the call. This data displays in the Call Details tab of the contact record.
End Date The date the call ended.
This data displays in the Call Details tab of the contact record.
End Time The time that the call ended in HH:MM:SS format.
You can display this field as a column in the call list.
This data displays in the Call Details tab of the contact record.
External Network The average voice quality at the junction where the call moves out of NiCE CXone Network to External Network, for example, call flow between NiCE CXone SBCs and carrier or partner devices.
SIP
Protocol used for signaling and controlling multimedia communication sessions such as voice and video calls. calls or non-WebRTC protocols.From The phone number from which the call originated.
You can filter calls based on the originator of the call.
You can display this field as a column in the call list.
This data displays in the Call Details tab of the contact record.
InboundPOC The traffic destined for ACD or IVR.
Internet Service Provider (ISP) The ISP the agent is connected to during the call.
This data displays in the Call Details tab of the contact record.
Jitter The amount of jitter for the call (in the NiCE CXone network or the external network).
This data displays in the Quality Details tab of the contact record.
Key A unique call identifier. All correlated contact IDs share the same key.
You can display this field as a column in the call list.
This data displays in the Call Details tab of the contact record.
Line Type The origin of the call, whether it came from a VoIP line, a PSTN landline, a PSTN cell phone, or any other type of line. Location City The city where the agent is located during the call.
This data displays in the Call Details tab of the contact record.
Location Country The country where the agent is located during the call.
This data displays in the Call Details tab of the contact record.
Master Contact ID The first contact ID associated with a call. If the agent transfers the call, a second contact ID is assigned to the call (called the Associated Contact ID). If the second agent transfers the call, then the Associated Contact ID becomes a new Master Contact ID. The new Master Contact ID has a new Associated Contact ID, which correlates to the third transfer destination.
You can filter calls based on the Master Contact ID.
You can display this field as a column in the call list.
This data displays in the Associated Contacts tab of the contact record.
Media Transport The media transport used during the call.
This data displays in the Call Details tab of the contact record.
MOS The mean opinion score (MOS) for the call (in the NiCE CXone network or the external network).
This data displays in the Quality Details tab of the contact record.
NaturalCallingDialer The outbound calls initiated by Personal Connection. Operating System The OS used at the time of the call.
This data displays in the Call Details tab of the contact record.
OS Version The OS version used at the time of the call.
This data displays in the Call Details tab of the contact record.
Packet Loss The amount of packet loss for the call in the NiCE CXone network or the external network.
This data displays in the Quality Details tab of the contact record.
Relationship The connection between contact IDs, such as agent leg Your audio connection to NiCE CXone for calls and voicemails., patron leg, transfer leg, and recording leg.R-Factor The R-factor score for the call in the NiCE CXone network or the external network.
This data displays in the Quality Details tab of the contact record.
Ring Time The amount of time the call rang before it was answered.
This data displays in the Call Details tab of the contact record.
Score The call quality score for this call (in the NiCE CXone network or the external network).
You can filter calls based on the call score.
This data displays in the Quality Details tab of the contact record.
SIP Protocol used for signaling and controlling multimedia communication sessions such as voice and video calls. Response CodeA code that details the status of the request.
This data displays in the Call Details tab of the contact record.
SIP Failure Code A code that indicates a request cannot be processed due to an error.
This data displays in the Call Details tab of the contact record.
SIP Is Dropped Code A code that indicates a call was dropped.
This data displays in the Call Details tab of the contact record.
SIP Abandoned by Originator A code that indicates a call was abandoned or disconnected due to an excessive wait time in the queue or a connection issue.
This data displays in the Call Details tab of the contact record.
Skill The name of the ACD skill
Used to automate delivery of interactions based on agent skills, abilities, and knowledge.NiCE CXone used to route the call to the agent. You can filter calls based on the skill name.
You can display this field as a column in the call list.
This data displays in the Call Details tab of the contact record.
Skill ID The ID of the ACD skill NiCE CXone used to route the call to the agent.
You can filter calls based on the skill ID.
You can display this field as a column in the call list.
This data displays in the Call Details tab of the contact record.
Source Lets you specify if you want to only view agent or contact call legs. Start Date The date the call started.
This data displays in the Call Details tab of the contact record.
Start Time The time that the call started (in HH:MM:SS format).
You can display this field as a column in the call list.
This data displays in the Call Details tab of the contact record.
Team The name of the team the agent is assigned to.
You can filter calls based on the team name.
You can display this field as a column in the call list.
This data displays in the Call Details tab of the contact record.
Team ID The ID of the team the agent is part of.
You can filter calls based on the team ID.
You can display this field as a column in the call list.
This data displays in the Call Details tab of the contact record.
To The destination phone number that was dialed.
You can filter calls based on the call destination number.
You can display this field as a column in the call list.
This data displays in the Call Details tab of the contact record.
-
Select a time range. After selecting a time range, the contact list populates with your query. Depending on your call volume, this may take a few minutes to load the results.
- To only view calls with quality issues, click the drop-down arrow from the Contact ID's summary tile and select either Poor or Moderate.
-
To find calls in the call list by specific parameters, click the Filter
 and select the appropriate metrics for calls you want to see.
 -
Click the row of the contact ID you want to view. The row expands to show the individual call details.
Use Advanced Search in Voice Quality Metrics
If you've filtered the call list and cannot find a specific contact ID, an Advanced Search link appears in the list. This lets you search through all calls in the ![]() High-level organizational grouping used to manage technical support, billing, and global settings for your NiCE CXone system.
High-level organizational grouping used to manage technical support, billing, and global settings for your NiCE CXone system.
- Click the app selector and select Monitoring Gateway.
-
Click Voice Quality Metrics.
-
In the free text field, enter the information you're looking for.
-
To search beyond your selected time frame, click the Advanced Search link.
Analyze Call Quality with Voice Diagnostics
Lets you view more in-depth call data at the level of individual call legs. It helps you pinpoint exactly where a call issue may have occurred in the connection. For example, you can see a breakdown of each RTP stream for the call. You can also review the call ladder![]() A diagram that provides in-depth details about a call's traffic, like individual server communications, SIP information, requested URIs, and so forth. to see which servers had connection issues.
A diagram that provides in-depth details about a call's traffic, like individual server communications, SIP information, requested URIs, and so forth. to see which servers had connection issues.
Voice Diagnostics is an optional feature that must be enabled. Contact your account representative for more information.
-
Click the app selector
and select Monitoring Gateway. -
Click Voice Quality Metrics.
-
- Select your load criteria, which is the High-level organizational grouping used to manage technical support, billing, and global settings for your NiCE CXone system.
- Use the filter or summary tiles to find your desired calls.
- Select your load criteria, which is the
-
From the list of calls, click the contact ID you want to analyze. The row expands to show the individual call details.
- Click the Voice Diagnostics button
 . The Voice Diagnostics page opens in a new browser tab.
 - Review the rows of call events in the Frame Viewer tab. This shows the source and destination IPs of the traffic to indicate if the issue is with NiCE CXone servers or external servers.
- Review the RTP streams to find segments with poor quality:
- Click the Media Quality tab.
- Expand or collapse the RTP drop-downs.
- Review the information and find MOS values. A value of 0-3.4 indicates poor or moderate quality.
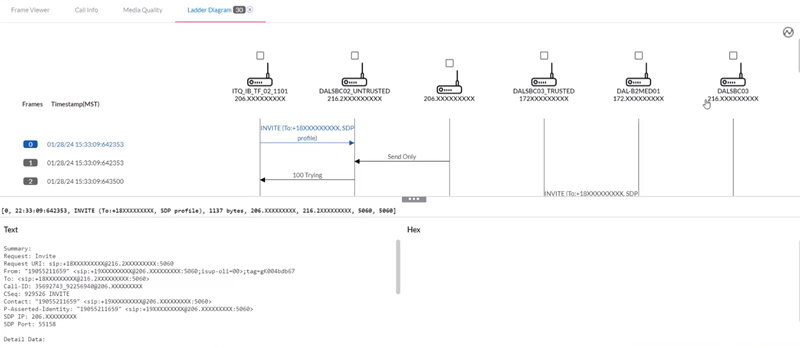
- Open the call ladder:
- Click the Frame Viewer tab.
- Click the graph button
 to view the call ladder.
- Review the call ladder diagram to locate traffic segments with issues. This diagram shows the server infrastructure of the call, helping you pinpoint the exact connection with issues. If you found RTP streams with poor quality, you can find the same RTP segments in the diagram, labeled RTP-1, RTP-2, and so on. You can also right-click to change the data that displays.
- Continue analyzing the data to find more details or patterns like time of day or certain servers communicating poorly.
Analyze Call Quality with the Call Quality Explorer
The Call Quality Explorer is an optional feature that must be enabled. Contact your account representative for more information.
This provides insight into the routing and how calls are connected. It displays information like call events, trunk groups, and devices. You can quickly see the sequence of events during the call, like a missing packets event or a CTI trigger event. Starting with a single contact ID, you can also track any associated IDs or where problematic events continued. If a call has associated IDs, you can also view the call's MegaLadder. This is like the call ladder in Voice Diagnostics, showing the call timeline and server traffic.
-
Click the app selector
and select Monitoring Gateway. -
Click Voice Quality Metrics.
-
- Select your load criteria, which is the High-level organizational grouping used to manage technical support, billing, and global settings for your NiCE CXone system.
- Use the filter or summary tiles to find your desired calls.
- Select your load criteria, which is the
-
From the list of calls, click the contact ID you want to analyze. The row expands to show the individual call details.
- Locate and hover over the contact ID inside the Call Details tab. A pop-up with several links displays.
- Click Call Quality Explorer. The explorer opens in a new browser tab.
- Click the contact ID in the list.
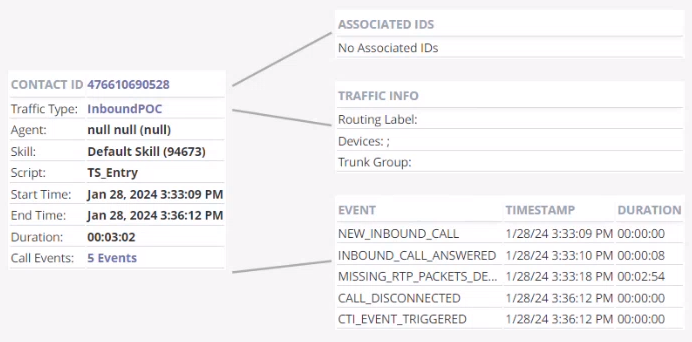
- Review the basic information.
- Click the number in the Call Events row. This opens a table showing each event, like where in the call flow there might have been missing RTP packets.
- Click the Traffic Type and CONTACT ID values to view traffic info and associated IDs.
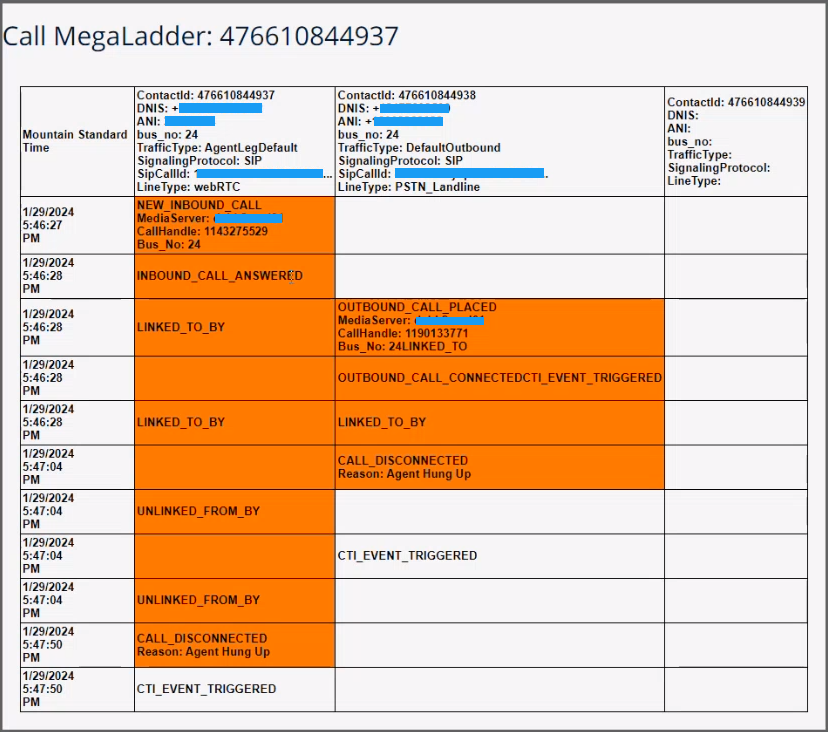
- If the call has any associated IDs, you can view the call MegaLadder. This is similar to the call ladder available in Voice Diagnostics, showing the timeline and server traffic of the call. If you have call recording enabled, you can also view information about the recording in the last column of the MegaLadder.
- If there are associated IDs and you have NiCE CXone Voice Diagnostics enabled, you can click CXONEVOICEDIAGNOSTICS to open Voice Diagnostics.
- Continue analyzing the data to find more details or patterns like time of day or certain servers communicating poorly.
Analyze Call Quality with WebRTC Analytics
An interactive page displaying all WebRTC data. You can track basic information like the ![]() High-level organizational grouping used to manage technical support, billing, and global settings for your NiCE CXone system.
High-level organizational grouping used to manage technical support, billing, and global settings for your NiCE CXone system.
Your organization must have WebRTC Analytics enabled to use this feature.
-
Click the app selector
and select Monitoring Gateway. -
Click Voice Quality Metrics.
-
- Select your load criteria, which is the High-level organizational grouping used to manage technical support, billing, and global settings for your NiCE CXone system.
- Use the filter or summary tiles to find your desired calls.
- Select your load criteria, which is the
-
From the list of calls, click the contact ID you want to analyze. The row expands to show the individual call details.
- Click the WebRTC Analytics button
 . The analytics opens in a new browser tab.
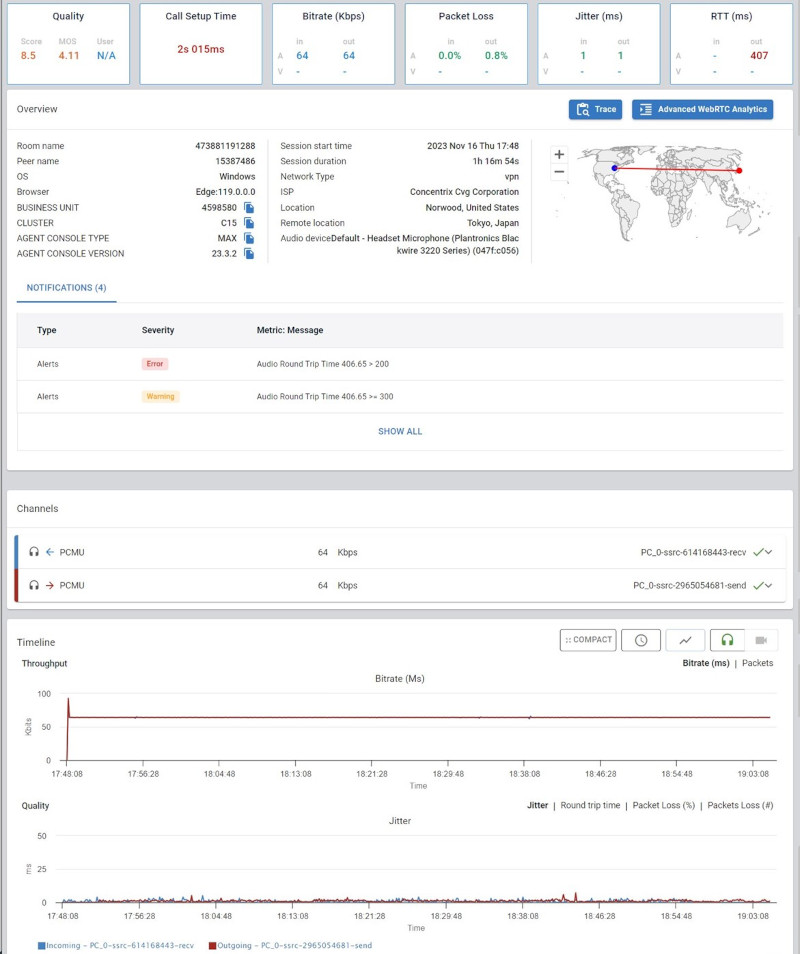
 - Review the summary information about the call at the top. This helps you decide which aspects to investigate, like a low bitrate or packet loss from incoming packets.
Learn more about fields in the Overview section
Field Details Room name The contact ID. Peer name The agent ID. OS The operating system used by the agent. Browser The browser and version used by the agent. Business Unit The High-level organizational grouping used to manage technical support, billing, and global settings for your NiCE CXone system.Cluster Your organization's NiCE CXone cluster. Agent Console Type The agent application that the agent used to handle the call. Agent Console Version The version of the agent application. This correlates with the major release of NiCE CXone. Network Type The type of network that the call happened over, like a VPN, wifi, or ethernet. ISP The internet service provider of the agent. Location The agent's network location. Remote location The contact's network location. - Review the notifications in the Overview section. These notifications indicate potential issues that you may want to investigate. In the example screenshot, the round trip time (RTT) for the example call has a severe issue. This is the amount of time it took for a request to travel from its origin, to its destination, then back to its origin. A good RTT measurement is below 100 milliseconds. A score above 400 may indicate that the connection was terminated.
- Review the channels section. This indicates the incoming and outgoing traffic. The blue arrow pointing toward the headphones indicates incoming audio for the agent. The red arrow pointing away from the headphones indicates outbound audio from the agent. This may indicate if you have download or upload speed issues.
- Review the timelines to see when any issues may have occurred. Bitrate and jitter display by default. You can display other data like Round trip time by clicking the timeline labels. Look for any sharp jumps or dips in the timeline. The throughput displays how much bandwidth the call is using.
- Click Trace to access errors logged to the console during the call.
- Click Advanced WebRTC Analytics to view:
- webrtc-internals.
- Active connections in webrtc-internals.
- webrtc-internals API trace.
Analyze Call Recordings in Voice Quality Metrics
Your organization must have call recording set up to use this feature.
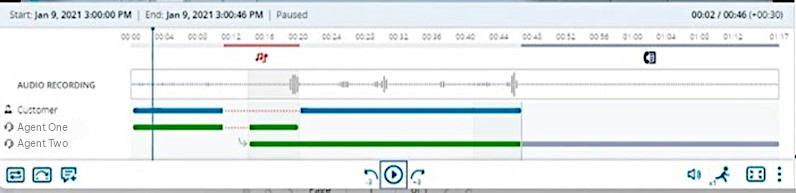
Voice Quality Metrics displays the recording in the Call Visualizer window. This lets you see the recording broken down by time duration, individual speakers, audio waveform, and so forth. You can also skip around the recording while listening. This lets you identify issues with individual participants, verify that quality issues exist, and experience how issues like jitter actually impact the quality.
While listening to a call recording, pay attention to things like:
-
Audio glitches.
-
Cut or one-way audio.
-
Lag or latency causing speakers to talk over each other.
-
Click the app selector
and select Monitoring Gateway. -
Click Voice Quality Metrics.
-
- Select your load criteria, which is the High-level organizational grouping used to manage technical support, billing, and global settings for your NiCE CXone system.
- Use the filter or summary tiles to find your desired calls.
- Select your load criteria, which is the
-
From the list of calls, click the contact ID you want to analyze. The row expands to show the individual call details.
- Click the call recording button
 . The analytics opens in a new browser tab.
 - Review the information displayed in the visualizer, like the call duration and participants.
- Press the play button to listen to the recording. If you used other features like Voice Diagnostics to identify specific parts of the call with issues, click in the timeline to jump to the specific time.
Export Call Data
You can export the call list data as a spreadsheet CSV file. This file contains:
-
Data from the columns that you've selected to display in the call list.
-
Data from the contact IDs that display in the call list. If you've filtered the list, the file does not include calls you filtered out.
- Click the app selector and select Monitoring Gateway.
-
Click Voice Quality Metrics.
-
Filter the calls you want to view.
-
Click the three dots icon
 at the top and click Export CSV.