You can create custom measures and metrics to have Uptivity Performance Management analyze data in ways that your organization needs. The BI Designer in the Web Portal is where you can create and edit metrics and measures You can also manage goals and trends in the BI Designer. Default system-generated measures cannot be modified.
When you create a measure, you must create a metric. Metrics tell Performance Management how to analyze the measure and give it context. The context defines the time period over which the measure is calculated and limits the calculation to the agent, group, or organization level.
You can also create goals for metrics and measures and enable trending for metrics.
Create a Measure
-
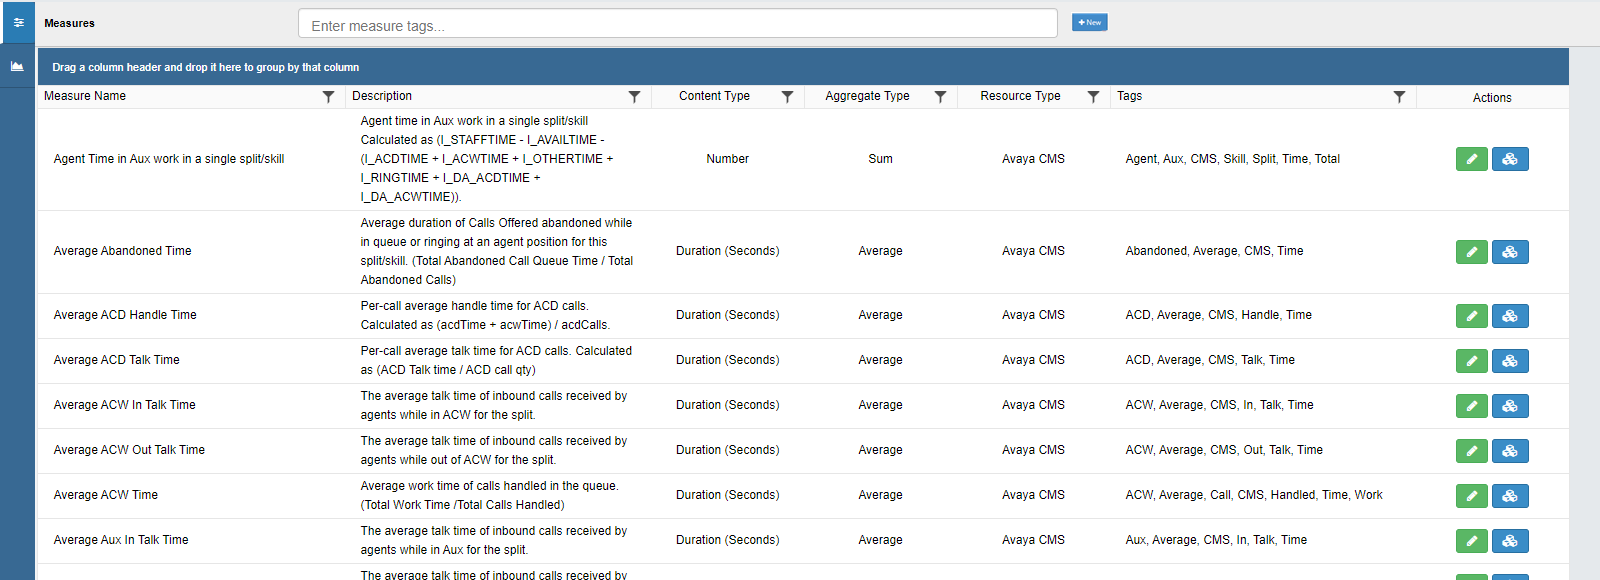
In Uptivity Web Portal, select Performance Management
 BI Designer and click the Measure Designer icon (indicated by 3 parallel lines).
 - Click New.
- Enter a unique Name and a Description for the measure.
- Select a Content Type, Aggregate Type, and Resource Type from the drop-down lists.
Learn more about the fields in this step

Field
Description
Content Type Content Type describes the value of a measure. Options are: Currency, Duration (Seconds), Number, and Percentage. Duration is stored in seconds and displayed as H-M-S. Aggregate Type Aggregate Type provides metadata only; it does not perform any computations. Options are: Any, Average, Count, First, Last, Maximum, Minimum, None, Rank, Score, Statistic, Std Deviation, Sum, and Weighted Score. Resource Type Resource Type defines the data source for the measure. Performance Management uses data collectors to collect and process business application data from a variety of disparate sources. The options available to you vary and depend on the sources your organization has available. -
If you are using trends or goals, enter a numeric value for Numeric Precision and Numeric Scale, then select a Bias.
Learn more about the fields in this step
Field
Description
Numeric Precision Numeric Scale Bias Select the bias you want the system to apply to this measure. Options are: Higher Is Worse and Lower Is Worse.
Bias is used in trending and goals, where you set values for Variance Type and Variance Value to work with bias. Not every measure has a bias, and the bias may be different for different measures and different customers. - For Display Scale, select the total number of digits for the displayed value.
- Select one or more Measure Tags. Measure tags help users find metrics to use in dashboard widgets, views, scorecards, tickers, and so on.
- Click Save.
Create a Metric
Metrics are not active in the Performance Management system until they are published. You can create a metric and save it, then return to it later and publish it to make it active. When a metric is saved but not published, its status is Edit. If a metric has been published, but the system experienced an issue during computation of the metric, the status is Problem.
-
Select Performance Management
BI Designer and click the Measure Designer icon in the left panel (indicated by three parallel lines). - Use the filtering tools to locate the measure you want to use.
-
Click the Metrics icon in the Actions column for the measure want to create a metric for.
- In the Manage Metrics window, click New.
- Select a Metric Type from the drop-down list. Learn more about the fields in this step
Metric Type
Description
Reference Use reference metrics to base one metric on another. For example, you might create a new reference metric based on the “hourly count” metric and use SQL to perform operations on it. Calculation Use calculation metrics to create metrics processed from data collected from a data source, such as Cisco UCCX or Coaching. Roll-Up Roll-up metrics are group metrics rolled up from agent metrics. This term is a simply name for these metrics and not a choice when creating metrics. - Select a Period Key from the drop-down list.
If you are creating a calculation metric, this is determined automatically and you can skip this step.Learn more about the fields in this step
Field
Description
Period Key The Period Key is set based on the Metric Type.
For reference metrics, the options are: 15 Minute, 30 Minute, Hour, Day, Week, Month, Quarter, Calendar, Year.
For calculation metrics, the period key is set by the system based on the metric data (making it read-only).
- Select a Frequency from the drop-down list.
- If you are creating a calculation metric, enter a SQL statement that identifies the metric data source in the Period SQL field.
- If you are creating a calculation metric, enter a value for Metric SQL if applicable.
- If you are using trending with this metric, select Display Trend.
- Configure the active period for the metric using the date selectors in the Active From and Active To fields.
Learn more about the fields in this step
Field
Description
Active Dates The Active From and Active To dates tell the system the periods for which to calculate the Metric. If you leave the Active To blank, the system treats the calculation period as if it has no end date. When a metric is used in scorecards or associated with a goal, the active period for the metric should align with the periods set for the goal and scorecard. - Click Save Metric.
- If you are ready to activate the metric, click Publish Metric. If you don't want this metric to be active right now, skip this step. You'll need to return to the metric and publish it at a later date to activate it.
Create a Basic Goal for a Measure
You can set basic goals for measures. If you want to create a goal for a metric, create an advanced goal.
-
Select Performance Management
BI Designer and then click the Goals icon (indicated by a graph) in the left panel. - Click the Basic Goals tab.
- Click Add New Goal.
- Enter the measureA simple measurement, such as: average talk time, average QA score, number of calls handled, average interaction talk time, etc. for the metricCalculates a measure for the various intervals of time and various roll-up combinations. The formula to create a metric is: a measure plus the keys for “what” and “when.” on which you want to set a goal. You can enter one or more keywords if you don't know the measure name. Use the Hint button if you're not sure.
- Select the metric you want to use and click Add.
- Click Next.
- For Target Value, enter the threshold value you want to set for the goal.
- For Variance Type, select one of the following from the drop-down list: Absolute or Percentage.
- Enter a Variance Value. Metrics are considered to be “At Goal” if they fall within a range of the Target Value plus / minus the Variance Value. For example, if the target value is 90, and the variance value is 3, then a metric value of 87-93 would be considered “At Goal”. Entering a value of 0 ensures that only metrics exactly meeting the target value are considered to be “At Goal”.
- Click Save.
Create an Advanced Goal for a Metric
You can set an advanced goal for any metric with a single "what" key that is Company, Group, or Agent. For example, you can set an advanced goal for “Agent, Week” but not “Agent, Skill”. In this example, "Agent, Week" has a single "what" key (Agent), but "Agent, Skill" has 2 "what keys (Agent and Skill).
If a measure and its metric both have goals and the goals conflict, the advanced goal (for the metric) takes precedence over the basic goal (for the measure).
-
Select Performance Management
BI Designer and click the Goals icon (indicated by a graph) in the left panel. - Click the Advanced Goals tab.
- Click Add New Goal.
- Click the type of goal you want to set: Agent, Group, or Company.
- For Time Period, select one of the following from the drop-down list: Day, Week, Month, Quarter, or Calendar Year.
- Enter the measureA simple measurement, such as: average talk time, average QA score, number of calls handled, average interaction talk time, etc. for the metricCalculates a measure for the various intervals of time and various roll-up combinations. The formula to create a metric is: a measure plus the keys for “what” and “when.” on which you want to set a goal. You can enter one or more keywords if you don't know the measure name. Use the Hint button if you're not sure.
- Locate the metric you want to use and click the Add icon.
- Click Next.
-
Use the date drop-downs, date selectors, or both to configure start and end dates for the goal. You can apply the advanced goal for an indefinite period by clearing the Specify Range checkbox.
If you are using metrics with goals on scorecards, be sure the goal period correlates with the active dates for the metric and the time period of the scorecard (see Creating Scorecards).
- If you are creating a goal for an agentThe person or people taking the inbound calls. or groupA definable collection of users. metric, specify the Agent or Group field. If you are creating a goal for a company metric, you can disregard this step.
- For Target Value, enter the desired threshold value for the goal.
- For Variance Type, select one of the following from the drop-down list: Absolute or Percentage.
- Enter a Variance Value. Metrics are considered to be “At Goal” if they fall within a range of the Target Value plus / minus the Variance Value. For example, if the target value is 90, and the variance value is 3, then a metric value of 87-93 would be considered “At Goal.” Entering a value of 0 ensures that only metrics exactly meeting the target value are considered to be “At Goal.”
- Click Save Goal.
Enable Trends for a Metric
- Select Performance Management BI Designer.
-
Click the Measure Designer icon (designated by three parallel lines) in the left panel.
- Locate the measureA simple measurement, such as: average talk time, average QA score, number of calls handled, average interaction talk time, etc. associated with the metric you want to trend and click the blue Metrics icon.
- For the metric you want to enable trends for, click the Edit icon.
- Select the Display Trend checkbox.
- For Trend Type, select one of the following from the drop-down list: Previous Period or Same Period Last Year.
- For Variance Type, select one of the following from the drop-down list: Absolute or Percentage.
- For Trend Variance, enter a value representing the variation that is considered acceptable before the trend is impacted. The number you enter is treated differently depending on the selected Variance Type. For example, a value of 10 may be 10 calls (absolute) or 10% (percentage).
For some measures, such as average hold time, a downward trend may be considered good. For others, such as upsell dollars, the opposite is true. Whether up or down is “better” is determined by the Bias field in the measure.
- Click Update Metric to save your changes, then click Publish Metric to push the changes to the published metric.


