After creating scorecards, you may periodically review them and decide to change what you are measuring, set different goals, or adjust the weighting for promotions or historically busy periods. For more information, see Balanced Scorecards Overview.
A scorecard can have different versions, which enables you to use the same scorecard for users![]() Individuals who have access to and can perform tasks in NICE Uptivity. They also appear in searches and in reporting. Users may include agents, supervisors, system administrators, and others. or groups
Individuals who have access to and can perform tasks in NICE Uptivity. They also appear in searches and in reporting. Users may include agents, supervisors, system administrators, and others. or groups![]() A definable collection of users., even when the scorecard inputs (metrics
A definable collection of users., even when the scorecard inputs (metrics![]() Calculates a measure for the various intervals of time and various roll-up combinations. The formula to create a metric is: a measure plus the keys for “what” and “when.”, goals, and so forth) change over time; you can view all scorecard versions in the Scorecard Explorer at Performance Management
Calculates a measure for the various intervals of time and various roll-up combinations. The formula to create a metric is: a measure plus the keys for “what” and “when.”, goals, and so forth) change over time; you can view all scorecard versions in the Scorecard Explorer at Performance Management ![]() BI Explorer
BI Explorer ![]() Explorer (indicated by a binoculars icon). The version is represented by the time period for which the scorecard metrics are calculated. Each new period for the scorecard creates a new version. You can also create a new version of a scorecard by ending the current scorecard period and starting a new period with your changes.
Explorer (indicated by a binoculars icon). The version is represented by the time period for which the scorecard metrics are calculated. Each new period for the scorecard creates a new version. You can also create a new version of a scorecard by ending the current scorecard period and starting a new period with your changes.
After you create and publish a scorecard, you can display it in any of the following ways:
- Scorecard Explorer
- Metric View
- Dashboard Widgets
- Scorecard Widget
- Metric View Widget
Scorecard Explorer
Use the Scorecard Explorer to view scorecards for multiple agents![]() The person or people taking the inbound calls. or groups
The person or people taking the inbound calls. or groups![]() A definable collection of users. at once, to view trending for a scorecard, or both. A scorecard is only calculated for the people and time periods for which it is configured. To access the Scorecard Explorer, click the graph icon in the left panel of the Explorer.
A definable collection of users. at once, to view trending for a scorecard, or both. A scorecard is only calculated for the people and time periods for which it is configured. To access the Scorecard Explorer, click the graph icon in the left panel of the Explorer.
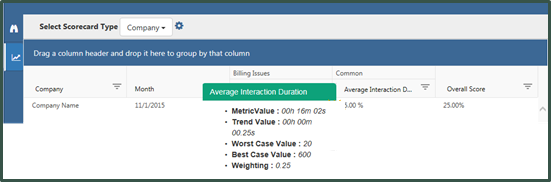
The Select Scorecard Type field in the Scorecard Explorer enables you to filter the type of scorecards displayed by Agent, Group, or Company. If you filter by agent, you can further filter for specific agents, or agents in specific groups. If you filter by group, you can filter for specific groups based on your permissions. The Group filter also tells you how many agents you selected.
When you click the Scorecard drop-down, a search field appears that allows you to search existing scorecards based on their attributes, such as title, metrics, description, and so forth.
You can drag and drop scorecard rows to compare them, and you can hover over any cell in a scorecard to see additional detail about the value, configuration, and score.
Metric View
Use the Performance Management ![]() BI Explorer tab to view scorecards for multiple agents or groups with goals.
BI Explorer tab to view scorecards for multiple agents or groups with goals.
The numbers on the image below highlight different sections of this view. The list below the image describes each section.
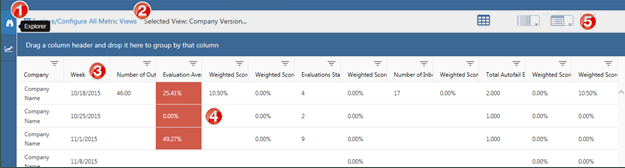
- Metric View Explorer tab.
- Name or selected view, including version.
- Calculated period.
- Goal - Cell color indicates performance against a defined goal.
- View format buttons - Click to toggle between Metric Grid, Analysis Grid, and Dimension Grid.
Dashboard
You have two options for putting a scorecard on the dashboard: the Scorecard widget and the Metric View widget. Scorecard widgets are best used to view single agents or groups, to see goals, to see trending, or any combination of these. Metric view widgets should be used to view scorecards for multiple agents or groups with goals.
The numbers on the image below highlight different sections of this view. The list below the image describes each section.
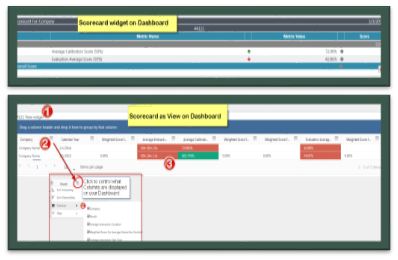
- Name of scorecard.
- Sort / filter by columns.
- Cell color indicates performance against a defined goal.
In a scorecard widget, you can hover over a cell to see additional information. Details include the metric value, trend value (the metric value from the “trend against” period), worst and best case values, and weighting. Scorecards present the goal and trend of the score (as opposed to the base value of the metric).
Remember that scorecards are calculated for select agents and groups as defined in the Scorecard Designer. When no data is presented, it means that the scorecard has not been configured to calculate the user or group.


