Understanding Uptivity Error Messages
Uptivity can be configured to notify you when issues require your attention. Issues are logged according to severity, and you can choose the level at which notifications are sent.
This topic is designed to help you understand these notifications and take appropriate action. Many issues can be resolved without a call to Uptivity Support, and following these guidelines should help you achieve the fastest resolution to any issues that arise. If you need to contact Support, you will be better able to provide critical information to your support engineer.
This topic provides general guidance, and is not meant to define the scope and severity of issues you may experience. Every Uptivity implementation is different. For example, if you have multiple screen capture servers, and one fails, the impact will be less than for a customer who has a single screen capture server.
For detailed information on configuring log levels and alerts, see Logging and Alerts Overview. For additional information regarding issue scope and severity, refer to guidelines provided by Uptivity Support. To learn more about redundancy and resiliency in Uptivity, contact your account representative.
How Can This Topic Help?
- Review the sample emails in the Anatomy of an Uptivity Alert section to become familiar with the way alerts are structured.
- When you receive an email alert from your Uptivity system, determine which application sent the message. Then review the Services Overview to see how that service
 NICE Uptivity includes a number of different services that perform various functions within the application. The services used in your system can vary depending on modules & features and system topology. affects your system.
 - Check the Logging Type in the email alert. Then look at the type in Alert Levels and take the appropriate action.
Anatomy of an Uptivity Alert
Email alerts sent by Uptivity pull information directly from the application logs and can be a bit challenging if you are not used to reading log data. Consider the following examples and explanations.
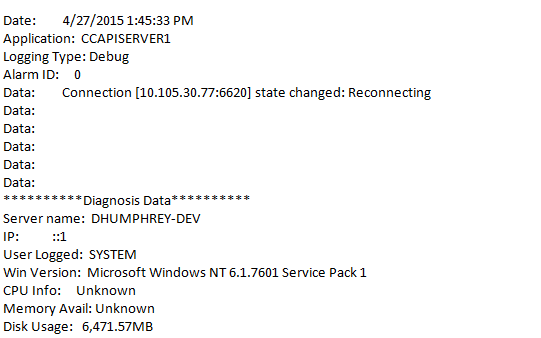
The preceding example contains the following information:
- Date — The date and time the log entry was created
- Application — The module or component within Uptivity that generated the log entry. In this case, the module was an API Server service named CCAPISERVER1. For more information, see Services Overview.
- Logging Type — The severity level of the event. In this case, the level was Debug. For more information, see Alert Levels.
- Alarm ID — This field is not currently used by Uptivity; you may safely disregard it
- Data — Description of the actual event. In this case, the state of the application changed to "Reconnecting."
- Diagnosis Data — This section provides details regarding the status of the server at the time the event occurred. For example, you can see the name of the logged-in user, disk usage, and so forth. This may or may not be useful, depending on the type of event.
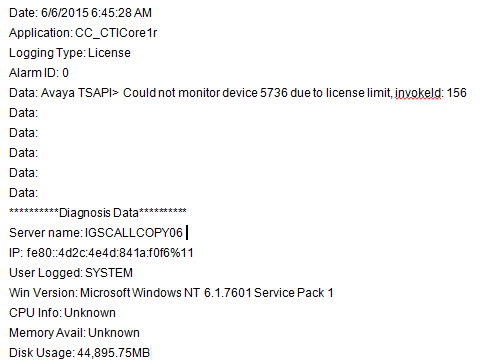
In this final example, a CTI Core![]() The software component that provides the PBX/ACD integration and makes call recording decisions based on customer-defined recording schedules. service named CC_CTICore1r generated a License level log entry at 6:45:28 AM on June 6, 2015. The module was unable to monitor device 5736 because there were no Avaya
The software component that provides the PBX/ACD integration and makes call recording decisions based on customer-defined recording schedules. service named CC_CTICore1r generated a License level log entry at 6:45:28 AM on June 6, 2015. The module was unable to monitor device 5736 because there were no Avaya![]() One of the many integrations available with Uptivity. TSAPI licenses available. This error would only be seen in an Avaya TSAPI environment.
One of the many integrations available with Uptivity. TSAPI licenses available. This error would only be seen in an Avaya TSAPI environment.


