Metric Views enable you to analyze and compare data from a collection of metrics, and are useful for exploring a collection of related KPIs![]() An acronym for Key Performance Indicator - a measurable value that demonstrates how effectively a company is achieving key business objectives..
An acronym for Key Performance Indicator - a measurable value that demonstrates how effectively a company is achieving key business objectives..
You can open a metric view or create a new one from Performance Management → BI Explorer. When you open a metric view, you have a flexible set of data analysis tools to explore the data in 3 different grids. You can switch between the different grids without losing changes.
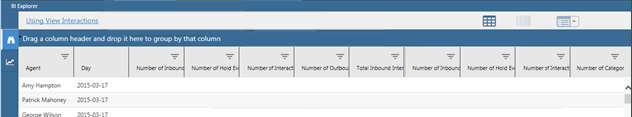
Search Grid View
The Search Grid is displayed by default. This view is a simple table and does not require additional configuration.
Analysis Grid View
The Analysis Grid presents the view metrics in a table format that you can sort, order, and filter. This grid is similar to a spreadsheet and useful for aggregating data in different ways for further analysis.

With this view, you can:
- Rearrange the columns by drag-and-dropping
- Export the grid to Excel, PDF, or CSV formats.
- Save the layouts for later use.
To save the Analysis Grid for later use:
- Click the drop-down indicator next to the Analysis Grid icon and select Save this grid.
- Enter a Grid Name and a Description.
- Click Save.
Dimension Grid View
The Dimension Grid provides additional ways to organize data and present it in graphical formats, such as a chart or heatmap. You can export Dimension Grids to Excel format.
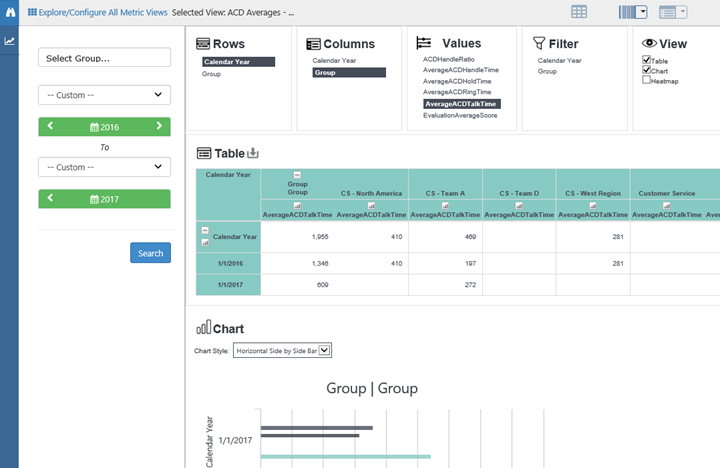
To configure a Dimension Grid:
- Select a Metric View.
- Click the Dimension Grid icon (indicated by a barcode icon).
- Click items in the Rows, Columns, Values, and Filters lists to configure the dimensions, metrics
 Calculates a measure for the various intervals of time and various roll-up combinations. The formula to create a metric is: a measure plus the keys for “what” and “when.” used, and grid display. As you make your selections, the grid appears in the area below.
 - If you want to, in the View list, select the checkbox(es) for Chart, Heatmap, or both to add these graphical elements to the grid display.
- Click the Explorer icon (signified by a pair of binoculars) in the left panel to open the left panel of settings. Configure the time period for the grid by selecting a pre-determined period from the drop-down list or by clicking the date selectors to choose a custom date range.
- If you want to, save the grid for future use. To do this:
- Click the drop-down indicator next to the Dimension Grid icon and select Save this grid.
- Enter a Grid Name and a Description.
- Click Save.


