Report Layout and Design Reference
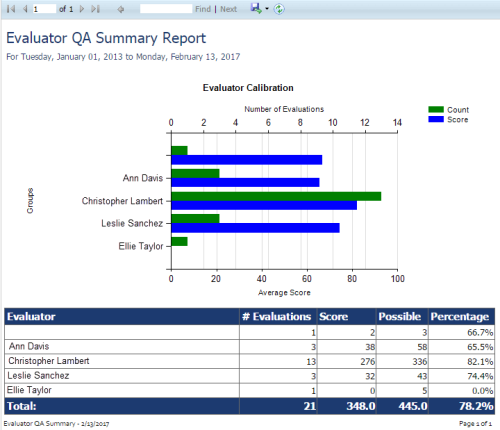
Uptivity uses the same basic layout to generate on-screen reports, whether they are printable or ad hoc. System reports may look different, and navigating these reports is discussed in the individual report descriptions
This topic explains how to view reports on-screen, and provides a reference to the common fields, settings, and controls on the report display.
For more information, see Reporting Overview.
Report Controls Bar
- Page Navigation
- Allow you to move to different pages within multi-page reports. The left-most icon takes you to the start of the report. The next icon takes you to the previous page. Following the display showing the current and total pages (1 of 1 in the preceding image), the next icon takes you to the next page. The final page navigation icon takes you to the end of the report.
- Move-Up Icon
- Designated by a left-pointing arrow, this icon allows you to move up one level if you have drilled down into a report. For more information, see
- Page Zoom
- Allows you to specify the size of the report display from the following drop-down list: Page Width, Whole Page, 500%, 200%, 150%, 100%, 75%, 50%, 25%, 10%.
This control is seen only when you use Internet Explorer as your browser.
- Search
- Allows you to find specific text or values within the displayed report by entering the search term and clicking Find (or pressing the [Enter] key). You can also click Next to move to the next instance of the term.
- Report Export Icon
- Allows you to export the report in a variety of formats. Choose one of the following from the drop-down list: XML file with report data; CSV (comma delimited); PDF; MHTML (web archive); Excel; TIFF file; Word.
Some reports display clickable links to call recording files or other information. These links do not work in exported versions of the report.
- Refresh Icon
- Allows you to refresh the report display (for example, if you want to return to the original display after sorting).
- Print Icon
- Allows you to print the report using standard Windows print controls.
This control is seen only when you use Internet Explorer as your browser. To print a report from another browser, export it as a PDF first.
Column Headings
You can sort a report by the contents of any column by clicking on the column heading once for ascending order or twice for descending order.
Drill-Down Options
Some reports allow you to drill down to see more specific information. For example, the image in this topic shows the Evaluator QA Summary report. You can drill down on each entry in this report to see the Evaluator QA Summary by Form report.
When a report offers drill-down options, the mouse pointer will turn to a hand when you hover over a field in the report. Some reports offer multiple drill-down options and levels. For example, in the report shown in this image, you can drill down from the original report to see these increasingly granular reports: Evaluator QA Summary by Form, Evaluator QA Summary by Section and Evaluator QA Summary by Question. See the NICE Uptivity Reports Reference Guide for details on specific reports.
