Getting Started with Dashboards
NICE Uptivity Performance Management Dashboards make it easy to broadcast and share data and information in visually-rich and impactful ways across your contact center.
For more information, see Dashboards Overview.
To get started with dashboards, Uptivity Performance Management features at least one starter dashboard template configured to track a selection of metrics using basic widgets.
All Performance Management users have access to the tab featuring dashboards and consolidated reports. This page displays when you click the Performance Management tab in the NICE Uptivity Web Portal, and displays one dashboard at a time.
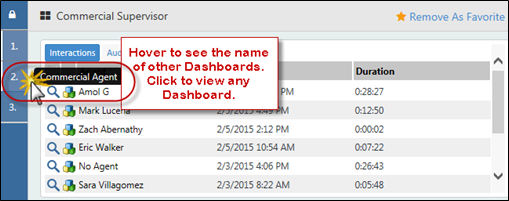
You may have multiple dashboards listed as numbers along the left side of the screen. Hover over the list to see names of any other dashboards published to your group. You can click any dashboard to view it, and make any available dashboard your favorite so that it is displayed on the page by default.
If multiple dashboards are available to you, but you do not want to see all of them as numbered choices, you can select which ones to hide or show. Dashboards are available to you if they were published to group(s) to which you belong. If you have permissions to create dashboards, then the list will also include dashboards you have created, but may not have published.
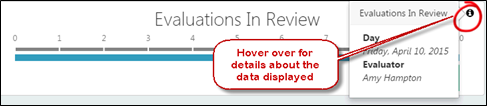
Each dashboard displays one or more widgets with information about metrics tracked in your contact center. To display basic details about the data presented in a metric widget, hover over the information icon.
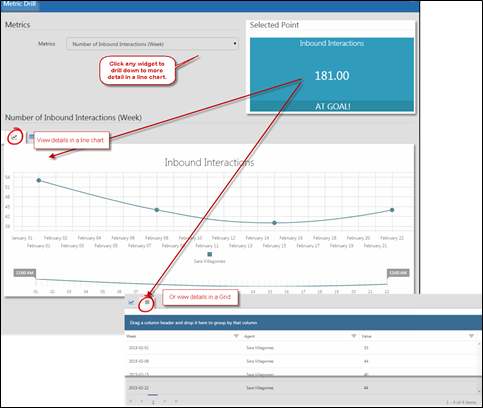
Some widgets allow you to drill down for additional data. For example, when data is presented per month, you can drill to per week, per day, and per hour, based on the availability of metrics for these keys. If a widget allows drill-down, the mouse pointer changes to a hand when you hover over the widget data.
For more information on the metrics, measures, and KPIs that are used in dashboard widgets, see the Understanding Measures, Metrics, and Keys.