Ad Hoc Report Builder
The Ad Hoc Report Builder page allows you to create and edit ad hoc reports.
This topic explains the settings and options in the Ad Hoc Report Builder.
For more information, see Ad Hoc Reports Overview.
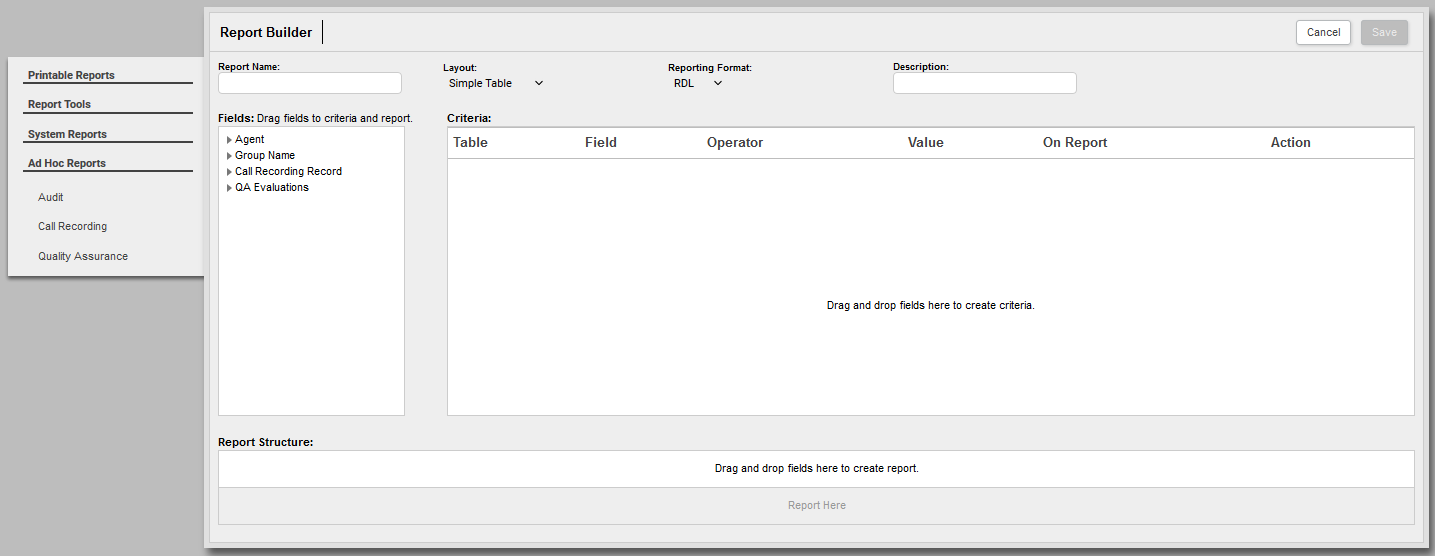
Report Appearance Options
- Report Name
- Allows you to specify a meaningful name (up to 50 characters) for the report. This name appears in the ad hoc reports list and in the list of available reports for subscriptions (if the report has been published).
- Layout
- Allows you to specify one of the following three layouts for the report:
- Simple Table — basic, list-style reports displaying a single row of fields. Columns can be rearranged by dragging fields left and right. Charts are not supported. See Recordings From a Particular Area Code for an example of this report layout.
- Summary Table — provides for nested, collapsible subcategories or groupings. Column fields can be dragged left and right to rearrange. Rows can be dragged up and down to regroup data. Lower fields are nested within higher fields. Bar and pie charts are supported. See QA Score in Relation to Content Library Items for an example of this report layout.
- Matrix Table — provides for measuring one or more pieces of information across a period of time. Fields controlling the information to be measured and the time range are displayed in the Columns area, and are limited to one field in each area per report. Fields that control grouping of that information are displayed in the Rows area. Multiple fields can be dragged, dropped, and rearranged to provide for different logical groupings of the information. Bar, pie and line charts are supported. Line charts illustrating large data sets may become difficult to read and use. See Average QA Score by Evaluator for an example of this report layout.
- Reporting Format
- Allows you to specify one of the following two formats for the report:
- RDL — works with Microsoft SQL Reporting Services and provides export formats of PDF, Microsoft Word, or Microsoft Excel files. Charts are simply laid out, displaying all the information in a non-interactive way. Large reports with pagination can be created. Categories and groupings in RDL reports are expanded by default. However, RDL reports do not support drill-down functionality.
- HTML — provides for reports and charts that are interactive. Information can be displayed on mouse-over, and clicking bars within a chart allows you to drill down into subcategories and see more detailed results. If there are multiple detail levels, clicking through will loop back to the top level. However, this format cannot be exported, does not support pagination, and is limited to displaying only 1000 results. HTML works best as a basic data preview, or for reports that will only be viewed online. Categories and groupings in HTML reports are collapsed by default. See QA Score in Relation to Content Library Items for an example of this report layout.
- Description
- Allows you to provide a brief description (up to 200 characters) for the report. This description appears in the ad hoc reports list and its content is included when you filter that page (see Ad Hoc Reports List).
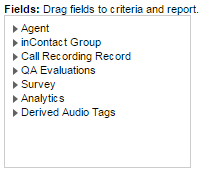
Fields
The Fields section provides access to the database fields you use to build reports. The categories and specific fields vary depending on the type of report. In some cases, field labels in this section are affected by your system's terminology settings (see Terminology Settings).
Field Categories for Call Recording Reports
| Active Agent | |
|---|---|
| Description | Indicates whether a user is an agent by displaying a value of either Active or Inactive. A user who is still in the system, but is no longer an agent, would show as Inactive. This might happen if an agent received a promotion or changed positions, and no longer is recorded. |
| Displays In | Ad hoc reporting |
| Filter/Search By | Ad hoc reporting |
| Format | N/A |
| Size | N/A |
| Limitations | Value is determined (assigned or calculated) by system and is not user-editable. See . |
| Terminology | This field label is editable and may appear differently in some parts of your system. See Terminology Settings. |
| Group Name (inContact Group) | |
|---|---|
| Description |
|
| Displays In | Quick Filters menu, ad hoc reporting, Call Recording Detail report |
| Filter/Search By | Quick Filters menu, ad hoc reporting |
| Format | Alphanumeric |
| Size | 255 characters |
| Limitations | |
| Terminology | This field label is editable and may appear differently in some parts of your system. See Terminology Settings. |
| Record ID | |
|---|---|
| Description | Unique identifier assigned to a recorded interaction in the inContact WFO database. |
| Displays In | Recorded Interactions with HTML5 Interaction Player, Recorded Interactions with Web Player |
| Filter/Search By | Recorded Interactions with HTML5 Interaction Player, Recorded Interactions with Web Player |
| Format | Numeric |
| Size | Varies |
| Limitations | Value is determined (assigned or calculated) by system and is not user-editable. |
| Terminology | N/A |
| Caller ID | |
|---|---|
| Description | Displays the number of the calling party (also known as the ANI). |
| Displays In | Recorded Interactions with HTML5 Interaction Player, Recorded Interactions with Web Player, Call Recording Detail, ad hoc reporting |
| Searchable In | Recorded Interactions |
| Format | Alphanumeric |
| Size | 20 characters |
| Limitations | Available only for inbound calls. Populated by information passed to inContact WFO from the integrated ACD/PBX. |
| Terminology | This field label is editable and may appear differently in some parts of your system. See Terminology Settings. |
| DNIS | |
|---|---|
| Description | For inbound calls, displays the number the caller dialed to reach you. For outbound calls, displays the number your agent dialed. |
| Displays In | Recorded Interactions with HTML5 Interaction Player, Recorded Interactions with Web Player, Call Recording Detail report, ad hoc reporting |
| Filter/Search By | Recorded Interactions with HTML5 Interaction Player, Recorded Interactions with Web Player, ad hoc reporting |
| Format | Alphanumeric |
| Size | 20 characters |
| Limitations | Populated by information passed to inContact WFO from the integrated ACD/PBX. |
| Terminology | This field label is editable and may appear differently in some parts of your system. See Terminology Settings. |
|
Device Alias |
|
|---|---|
| Description |
|
| Displays In | Recorded Interactions with HTML5 Interaction Player, Recorded Interactions with Web Player, Agent Call Summary report, ad hoc reporting |
| Filter/Search By | Recorded Interactions with HTML5 Interaction Player, Recorded Interactions with Web Player |
| Format | Alphanumeric |
| Size | 100 characters |
| Limitations | Populated by information passed to inContact WFO from the integrated ACD/PBX. |
| Terminology | This field label is editable and may appear differently in some parts of your system. See Terminology Settings. |
| Time Recorded (Recording Time) | |
|---|---|
| Description | Displays the date and time the interaction was recorded. The time displays in either AM/PM or 24-hour format, depending on how your system is configured. |
| Displays In | Recorded Interactions with HTML5 Interaction Player, Recorded Interactions with Web Player, Call Recording Detail report, ad hoc reporting |
| Filter/Search By | Recorded Interactions with HTML5 Interaction Player, Recorded Interactions with Web Player, Call Recording Detail report, ad hoc reporting |
| Format | Date/Time |
| Size | Displays as MM/DD/YYYY HH:MM |
| Limitations | Value is determined (assigned or calculated) by system and is not user-editable. |
| Terminology | N/A |
| Call Direction | |
|---|---|
| Description | Displays the directionality of the call as either Inbound, Outbound, or Unknown. In this context, Unknown means that inContact WFO was not able to identify the directionality of the recorded contact. |
| Displays In | Recorded Interactions with HTML5 Interaction Player, Recorded Interactions with Web Player, Call Recording Detail, ad hoc reporting |
| Filter/Search By | Recorded Interactions with HTML5 Interaction Player, Recorded Interactions with Web Player, ad hoc reporting |
| Format | Alpha |
| Size | 1 (I/O) |
| Limitations | Value is determined (assigned or calculated) by system and is not user-editable. |
| Terminology | N/A |
| Duration | |
|---|---|
| Description | Displays the duration of the recorded contact. |
| Displays In | Recorded Interactions with HTML5 Interaction Player, Recorded Interactions with Web Player, Call Recording Detail report, ad hoc reporting |
| Filter/Search By | Recorded Interactions with HTML5 Interaction Player, Recorded Interactions with Web Player, ad hoc reporting |
| Format | Numeric |
| Size | Displays as HH:MM:SS |
| Limitations | Value is determined (assigned or calculated) by system and is not user-editable. |
| Terminology | N/A |
| sGroup (ACD Group, Group) | |
|---|---|
| Description |
|
| Displays In | Recorded Interactions with HTML5 Interaction Player, Recorded Interactions with Web Player, Call Recording Detail report, ad hoc reporting |
| Filter/Search By | Recorded Interactions with HTML5 Interaction Player, Recorded Interactions with Web Player, ad hoc reporting |
| Format | Alphanumeric |
| Size | 30 characters |
| Limitations | Populated by information passed to inContact WFO from the integrated ACD/PBX. |
| Terminology | This field label is editable and may appear differently in some parts of your system. See Terminology Settings. |
| Gate | |
|---|---|
| Description |
|
| Displays In | Recorded Interactions with HTML5 Interaction Player, Recorded Interactions with Web Player, Call Recording Detail report, ad hoc reporting |
| Filter/Search By | Recorded Interactions with HTML5 Interaction Player, Recorded Interactions with Web Player |
| Format | Alphanumeric |
| Size | 20 characters |
| Limitations | Populated by information passed to inContact WFO from the integrated ACD/PBX. |
| Terminology | This field label is editable and may appear differently in some parts of your system. See Terminology Settings. |
| User 1 | |
|---|---|
| Description |
|
| Displays In | Recorded Interactions with HTML5 Interaction Player, Recorded Interactions with Web Player, Call Recording Detail report, ad hoc reporting |
| Filter/Search By | Recorded Interactions with HTML5 Interaction Player, Recorded Interactions with Web Player, ad hoc reporting |
| Format | Alphanumeric |
| Size | 20 characters |
| Limitations | |
| Terminology | This field label is editable and may appear differently in some parts of your system. See Terminology Settings. |
| User 2 | |
|---|---|
| Description |
|
| Displays In | Recorded Interactions with HTML5 Interaction Player, Recorded Interactions with Web Player, Call Recording Detail report, ad hoc reporting |
| Filter/Search By | Recorded Interactions with HTML5 Interaction Player, Recorded Interactions with Web Player, ad hoc reporting |
| Format | Alphanumeric |
| Size | 20 characters |
| Limitations | |
| Terminology | This field label is editable and may appear differently in some parts of your system. See Terminology Settings. |
| User 3 | |
|---|---|
| Description |
|
| Displays In | Recorded Interactions with HTML5 Interaction Player, Recorded Interactions with Web Player, Call Recording Detail report, ad hoc reporting |
| Searchable In | Recorded Interactions with HTML5 Interaction Player, Recorded Interactions with Web Player, ad hoc reporting |
| Format | Alphanumeric |
| Size | 20 characters |
| Limitations | |
| Terminology | This field label is editable and may appear differently in some parts of your system. See Terminology Settings. |
| User 4 | |
|---|---|
| Description |
|
| Displays In | Recorded Interactions with HTML5 Interaction Player, Recorded Interactions with Web Player, Call Recording Detail report, ad hoc reporting |
| Filter/Search By | Recorded Interactions with HTML5 Interaction Player, Recorded Interactions with Web Player, ad hoc reporting |
| Format | Alphanumeric |
| Size | 255 characters |
| Limitations | |
| Terminology | This field label is editable and may appear differently in some parts of your system. See Terminology Settings. |
| User 5 | |
|---|---|
| Description |
|
| Displays In | Recorded Interactions with HTML5 Interaction Player, Recorded Interactions with Web Player, Call Recording Detail report, ad hoc reporting |
| Filter/Search By | Recorded Interactions with HTML5 Interaction Player, Recorded Interactions with Web Player, ad hoc reporting |
| Format | Alphanumeric |
| Size | 255 characters |
| Limitations | |
| Terminology | This field label is editable and may appear differently in some parts of your system. See Terminology Settings. |
| User 6 | |
|---|---|
| Description |
|
| Displays In | Recorded Interactions with HTML5 Interaction Player, Recorded Interactions with Web Player, Call Recording Detail report, ad hoc reporting |
| Filter/Search By | Recorded Interactions with HTML5 Interaction Player, Recorded Interactions with Web Player, ad hoc reporting |
| Format | Alphanumeric |
| Size | 255 characters |
| Limitations | |
| Terminology | This field label is editable and may appear differently in some parts of your system. See Terminology Settings. |
| User 7 | |
|---|---|
| Description |
|
| Displays In | Recorded Interactions with HTML5 Interaction Player, Recorded Interactions with Web Player, Call Recording Detail report, ad hoc reporting |
| Filter/Search By | Recorded Interactions with HTML5 Interaction Player, Recorded Interactions with Web Player, ad hoc reporting |
| Format | Alphanumeric |
| Size | 255 characters |
| Limitations | |
| Terminology | This field label is editable and may appear differently in some parts of your system. See Terminology Settings. |
| User 8 | |
|---|---|
| Description |
|
| Displays In | Recorded Interactions with HTML5 Interaction Player, Recorded Interactions with Web Player, Call Recording Detail report, ad hoc reporting |
| Filter/Search By | Recorded Interactions with HTML5 Interaction Player, Recorded Interactions with Web Player, ad hoc reporting |
| Format | Alphanumeric |
| Size | 255 characters |
| Limitations | |
| Terminology | This field label is editable and may appear differently in some parts of your system. See Terminology Settings. |
| User 9 | |
|---|---|
| Description |
|
| Displays In | Recorded Interactions with HTML5 Interaction Player, Recorded Interactions with Web Player, Call Recording Detail report, ad hoc reporting |
| Filter/Search By | Recorded Interactions with HTML5 Interaction Player, Recorded Interactions with Web Player, ad hoc reporting |
| Format | Alphanumeric |
| Size | 50 characters |
| Limitations | |
| Terminology | This field label is editable and may appear differently in some parts of your system. See Terminology Settings. |
| User 10 | |
|---|---|
| Description |
|
| Displays In | Recorded Interactions with HTML5 Interaction Player, Recorded Interactions with Web Player, Call Recording Detail report, ad hoc reporting |
| Filter/Search By | Recorded Interactions with HTML5 Interaction Player, Recorded Interactions with Web Player, ad hoc reporting |
| Format | Alphanumeric |
| Size | 50 characters |
| Limitations | |
| Terminology | This field label is editable and may appear differently in some parts of your system. See Terminology Settings. |
| User 11 | |
|---|---|
| Description |
|
| Displays In | Recorded Interactions with HTML5 Interaction Player, Recorded Interactions with Web Player, Call Recording Detail report, ad hoc reporting |
| Filter/Search By | Recorded Interactions with HTML5 Interaction Player, Recorded Interactions with Web Player, ad hoc reporting |
| Format | Alphanumeric |
| Size | 50 characters |
| Limitations | Value is determined (assigned or calculated) by system and is not user-editable. |
| Terminology | This field label is editable and may appear differently in some parts of your system. See Terminology Settings. |
| User 12 | |
|---|---|
| Description |
|
| Displays In | Recorded Interactions with HTML5 Interaction Player, Recorded Interactions with Web Player, Call Recording Detail report, ad hoc reporting |
| Filter/Search By | Recorded Interactions with HTML5 Interaction Player, Recorded Interactions with Web Player, ad hoc reporting |
| Format | Alphanumeric |
| Size | 50 characters |
| Limitations | Value is determined (assigned or calculated) by system and is not user-editable. |
| Terminology | This field label is editable and may appear differently in some parts of your system. See Terminology Settings. |
| User 13 | |
|---|---|
| Description |
|
| Displays In | Recorded Interactions with HTML5 Interaction Player, Recorded Interactions with Web Player, Call Recording Detail report, ad hoc reporting |
| Filter/Search By | Recorded Interactions with HTML5 Interaction Player, Recorded Interactions with Web Player, ad hoc reporting |
| Format | Alphanumeric |
| Size | 50 characters |
| Limitations | Value is determined (assigned or calculated) by system and is not user-editable. |
| Terminology | This field label is editable and may appear differently in some parts of your system. See Terminology Settings. |
| User 14 | |
|---|---|
| Description |
|
| Displays In | Recorded Interactions with HTML5 Interaction Player, Recorded Interactions with Web Player, Call Recording Detail report, ad hoc reporting |
| Filter/Search By | Recorded Interactions with HTML5 Interaction Player, Recorded Interactions with Web Player, ad hoc reporting |
| Format | Alphanumeric |
| Size | 50 characters |
| Limitations | Value is determined (assigned or calculated) by system and is not user-editable. |
| Terminology | This field label is editable and may appear differently in some parts of your system. See Terminology Settings. |
| User 15 | |
|---|---|
| Description |
|
| Displays In | Recorded Interactions with HTML5 Interaction Player, Recorded Interactions with Web Player, Call Recording Detail report, ad hoc reporting |
| Filter/Search By | Recorded Interactions with HTML5 Interaction Player, Recorded Interactions with Web Player, ad hoc reporting |
| Format | Alphanumeric |
| Size | 50 characters |
| Limitations | Value is determined (assigned or calculated) by system and is not user-editable. |
| Terminology | This field label is editable and may appear differently in some parts of your system. See Terminology Settings. |
| Completed Evaluations (Recording) | |
|---|---|
| Description | Number of inContact Quality Management evaluations completed for a recorded interaction. |
| Displays In | Recorded Interactions with HTML5 Interaction Player, Recorded Interactions with Web Player, ad hoc reporting |
| Filter/Search By | Recorded Interactions with HTML5 Interaction Player, Recorded Interactions with Web Player |
| Format | Numeric |
| Size | N/A |
| Limitations | Value is determined (assigned or calculated) by system and is not user-editable. |
| Terminology | N/A |
| QA Score (Recording) | |
|---|---|
| Description | Total number of points scored on inContact Quality Management evaluations completed for a recorded interaction. |
| Displays In | Ad hoc reporting |
| Filter/Search By | Ad hoc reporting |
| Format | Numeric |
| Size | 10,2 (for example, 12345678.90) |
| Limitations | Value is determined (assigned or calculated) by system and is not user-editable. |
| Terminology | N/A |
| Possible QA Score (Recording) | |
|---|---|
| Description | Total number of possible points on inContact Quality Management evaluations completed for a recorded interaction. |
| Displays In | Ad hoc reporting |
| Filter/Search By | Ad hoc reporting |
| Format | Numeric |
| Size | 10,2 (for example, 12345678.90) |
| Limitations | Value is determined (assigned or calculated) by system and is not user-editable. |
| Terminology | N/A |
Field Categories for Quality Assurance Reports
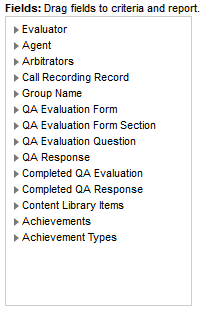
Quality Assurance (QA) data available for ad hoc reporting includes both QA form data and completed QA data. It is important not to mix these data types. Mixing them can yield inaccurate, inconsistent, or unexpected results. In general, QA reporting can serve two purposes:
- Reporting on available QA forms (QA Form, Sections, Questions and available responses).
- Reporting on completed QA evaluations, which is what the vast majority of the printable reports provide
Using a single interface to create reports for both purposes is challenging because this data has different meanings and is linked together depending on context. To help ensure accurate reporting, keep the following in mind when building reports:
- Use categories beginning with "QA" to report on available QA forms (for example, a listing of forms that include a specific question)
- Use categories beginning with "Completed QA" to report on QA evaluations (for example, a listing of evaluations performed by a specific evaluator)
| Evaluator Name | |
|---|---|
| Description | Combines the First Name and Last Name database fields for a user and displays as Last Name, First Name. This information is not retained in the database as a single field. |
| Displays In | Ad hoc reporting |
| Filter/Search By | Ad hoc reporting |
| Format | Alphanumeric |
| Size | Variable |
| Limitations | Value is determined (assigned or calculated) by system and is not user-editable. |
| Terminology | N/A |
Evaluator Status
| Active | |
|---|---|
| Description | Indicates whether a user is active or inactive. Inactive users are those who have been |
| Displays In | Ad hoc reporting |
| Search/Filter By | Ad hoc reporting |
| Format | Numeric |
| Size | 1 character (1 for active/O for inactive) |
| Limitations | |
| Terminology | N/A |
| Agent Name | |
|---|---|
| Description | Combines the First Name and Last Name database fields for a user and displays as Last Name, First Name. This information is not retained in the database as a single field. |
| Displays In | Agent Call Summary, ad hoc reporting |
| Filter/Search By | Ad hoc reporting |
| Format | Alphanumeric |
| Size | Varies |
| Limitations | Value is determined (assigned or calculated) by system and is not user-editable. |
| Terminology | N/A |
Agent Status
| Active Agent | |
|---|---|
| Description | Indicates whether a user is an agent by displaying a value of either Active or Inactive. A user who is still in the system, but is no longer an agent, would show as Inactive. This might happen if an agent received a promotion or changed positions, and no longer is recorded. |
| Displays In | Ad hoc reporting |
| Filter/Search By | Ad hoc reporting |
| Format | N/A |
| Size | N/A |
| Limitations | Value is determined (assigned or calculated) by system and is not user-editable. See . |
| Terminology | This field label is editable and may appear differently in some parts of your system. See Terminology Settings. |
| Arbitrator Name | |
|---|---|
| Description | Combines the First Name and Last Name database fields for a user and displays as Last Name, First Name. This information is not retained in the database as a single field. This field identifies the first arbitrator to open and review a disputed evaluation, even if they don't edit or rescore it. |
| Displays In | Ad hoc reporting |
| Searchable In | |
| Format | Alphanumeric |
| Size | Variable |
| Limitations | Value is determined (assigned or calculated) by system and is not user-editable. |
| Terminology | N/A |
Arbitrator Status
| Active | |
|---|---|
| Description | Indicates whether a user is active or inactive. Inactive users are those who have been |
| Displays In | Ad hoc reporting |
| Search/Filter By | Ad hoc reporting |
| Format | Numeric |
| Size | 1 character (1 for active/O for inactive) |
| Limitations | |
| Terminology | N/A |
| Record ID | |
|---|---|
| Description | Unique identifier assigned to a recorded interaction in the inContact WFO database. |
| Displays In | Recorded Interactions with HTML5 Interaction Player, Recorded Interactions with Web Player |
| Filter/Search By | Recorded Interactions with HTML5 Interaction Player, Recorded Interactions with Web Player |
| Format | Numeric |
| Size | Varies |
| Limitations | Value is determined (assigned or calculated) by system and is not user-editable. |
| Terminology | N/A |
| Caller ID | |
|---|---|
| Description | Displays the number of the calling party (also known as the ANI). |
| Displays In | Recorded Interactions with HTML5 Interaction Player, Recorded Interactions with Web Player, Call Recording Detail, ad hoc reporting |
| Searchable In | Recorded Interactions |
| Format | Alphanumeric |
| Size | 20 characters |
| Limitations | Available only for inbound calls. Populated by information passed to inContact WFO from the integrated ACD/PBX. |
| Terminology | This field label is editable and may appear differently in some parts of your system. See Terminology Settings. |
| DNIS | |
|---|---|
| Description | For inbound calls, displays the number the caller dialed to reach you. For outbound calls, displays the number your agent dialed. |
| Displays In | Recorded Interactions with HTML5 Interaction Player, Recorded Interactions with Web Player, Call Recording Detail report, ad hoc reporting |
| Filter/Search By | Recorded Interactions with HTML5 Interaction Player, Recorded Interactions with Web Player, ad hoc reporting |
| Format | Alphanumeric |
| Size | 20 characters |
| Limitations | Populated by information passed to inContact WFO from the integrated ACD/PBX. |
| Terminology | This field label is editable and may appear differently in some parts of your system. See Terminology Settings. |
| Device ID | |
|---|---|
| Description |
|
| Displays In | Recorded Interactions with HTML5 Interaction Player, Recorded Interactions with Web Player, Agent Call Summary report, ad hoc reporting |
| Filter/Search By | Recorded Interactions with HTML5 Interaction Player, Recorded Interactions with Web Player, ad hoc reporting |
| Format | Alphanumeric |
| Size | 100 characters |
| Limitations | Populated by information passed to inContact WFO from the integrated ACD/PBX. |
| Terminology | This field label is editable and may appear differently in some parts of your system. See Terminology Settings. |
|
Device Alias |
|
|---|---|
| Description |
|
| Displays In | Recorded Interactions with HTML5 Interaction Player, Recorded Interactions with Web Player, Agent Call Summary report, ad hoc reporting |
| Filter/Search By | Recorded Interactions with HTML5 Interaction Player, Recorded Interactions with Web Player |
| Format | Alphanumeric |
| Size | 100 characters |
| Limitations | Populated by information passed to inContact WFO from the integrated ACD/PBX. |
| Terminology | This field label is editable and may appear differently in some parts of your system. See Terminology Settings. |
| Group Name (inContact Group) | |
|---|---|
| Description |
|
| Displays In | Quick Filters menu, ad hoc reporting, Call Recording Detail report |
| Filter/Search By | Quick Filters menu, ad hoc reporting |
| Format | Alphanumeric |
| Size | 255 characters |
| Limitations | |
| Terminology | This field label is editable and may appear differently in some parts of your system. See Terminology Settings. |
| Form Name | |
|---|---|
| Description | The name of a form used in to evaluate agents in inContact Quality Management. |
| Displays In | QA Forms list, Ad hoc reporting |
| Filter/Search By | QA Forms list, Ad hoc reporting |
| Format | Alphanumeric |
| Size | 255 characters |
| Limitations | |
| Terminology | N/A |
| Acknowledgment Required | |
|---|---|
| Description | Indicates whether the default behavior for a QA form is to require agent acknowledgment. |
| Displays In | Ad hoc reporting |
| Filter/Search By | Ad hoc reporting |
| Format | Numeric |
| Size | 1 character (a value of 1 displays as Yes; a value of 0 displays as No) |
| Limitations | |
| Terminology | N/A |
| (Form) Create Date | |
|---|---|
| Description | Date on which a QA evaluation form was first saved. |
| Displays In | QA Forms list, Ad hoc reporting |
| Filter/Search By | QA Forms list, Ad hoc reporting |
| Format | Date/Time |
| Size | Displays as MM/DD/YYYY HH:MM:SS AM/PM |
| Limitations | Value is determined (assigned or calculated) by system and is not user-editable. |
| Terminology | N/A |
| Form Status | |
|---|---|
| Description | Indicates whether a form is enabled (active) or disabled (inactive). |
| Displays In | QA Forms list, ad hoc reporting |
| Filter/Search By | QA Forms list, ad hoc reporting |
| Format | Numeric |
| Size | 1 character (1 for active/O for inactive) |
| Limitations | This field cannot be blank. |
| Terminology | N/A |
| (Form) Disable Date | |
|---|---|
| Description | Date on which a QA evaluation form was most recently disabled. |
| Displays In | QA Forms list, Ad hoc reporting |
| Filter/Search By | QA Forms list, Ad hoc reporting |
| Format | Date/Time |
| Size | Displays as MM/DD/YYYY HH:MM:SS AM/PM |
| Limitations | Value is determined (assigned or calculated) by system and is not user-editable. |
| Terminology | N/A |
| Section Order | |
|---|---|
| Description | Indicates where a section falls in the overall order of a specified QA form. For example, for the third section on a form, this field would display a value of 3. |
| Displays In | Ad hoc reporting |
| Filter/Search By | Ad hoc reporting |
| Format | Numeric |
| Size | Varies |
| Limitations | Value is determined (assigned or calculated) by system and is not user-editable. |
| Terminology | N/A |
| Section Name | |
|---|---|
| Description | Indicates the name of a section in a specified QA form. |
| Displays In | Ad hoc reporting |
| Filter/Search By | Ad hoc reporting |
| Format | Alphanumeric |
| Size | 255 characters |
| Limitations | |
| Terminology | N/A |
| Form Question, Completed Question | |
|---|---|
| Description | User-defined question for a specified QA form. |
| Displays In | Ad hoc reporting |
| Filter/Search By | Ad hoc reporting |
| Format | Alphanumeric |
| Size | 1024 characters |
| Limitations | |
| Terminology | N/A |
| Question Order | |
|---|---|
| Description | Indicates where a question falls in the overall order within a section of a specified QA form. For example, for the third question in the first section on a form, this field would display a value of 3. The third question in the second section of the same form would also display a value of 3. |
| Displays In | Ad hoc reporting |
| Filter/Search By | Ad hoc reporting |
| Format | Numeric |
| Size | Varies |
| Limitations | Value is determined (assigned or calculated) by system and is not user-editable. |
| Terminology | N/A |
| Question Priority | |
|---|---|
| Description | Indicates whether the question was designated as Critical by the form's creator. |
| Displays In | Ad hoc reporting |
| Filter/Search By | Ad hoc reporting |
| Format | Alphanumeric |
| Size | Varies |
| Limitations | All questions are assigned a priority of Normal unless specifically designated Critical. See Critical Questions. |
| Terminology | N/A |
| Possible Score (Question) | |
|---|---|
| Description | Total number of possible points available for a specific question on a QA form. |
| Displays In | Ad hoc reporting |
| Filter/Search By | Ad hoc reporting |
| Format | Numeric |
| Size | 6, 2 (for example, 1234.56) |
| Limitations | |
| Terminology | N/A |
| Response Order | |
|---|---|
| Description | Indicates where a response falls in the overall order within a question on a specified QA form. For example, for the third response to the first question on a form, this field would display a value of 3. The third response to the second question on the same form would also display a value of 3. |
| Displays In | Ad hoc reporting |
| Filter/Search By | Ad hoc reporting |
| Format | Numeric |
| Size | Varies |
| Limitations | Value is determined (assigned or calculated) by system and is not user-editable. |
| Terminology | N/A |
| Available Response, Question Response | |
|---|---|
| Description | User-defined response for a question on a specified QA form. In conjunction with a completed evaluation, displays the response selected by the evaluator. |
| Displays In | Ad hoc reporting |
| Filter/Search By | Ad hoc reporting |
| Format | Alphanumeric |
| Size | 50 characters |
| Limitations | This field cannot be blank. |
| Terminology | N/A |
| Auto-Fail | |
|---|---|
| Description | Indicates the Auto-Fail value selected for a question on a QA form by the form's creator. |
| Displays In | Ad hoc reporting (displays as f for form auto-fail, s for section auto-fail, and 0 for no auto-fail) |
| Filter/Search By | Ad hoc reporting |
| Format | Alphanumeric |
| Size | 1 character |
| Limitations | |
| Terminology | N/A |
| Response Score, Possible Score | |
|---|---|
| Description | User-defined score for a response to a question on a specified QA form. |
| Displays In | Ad hoc reporting |
| Filter/Search By | Ad hoc reporting |
| Format | Numeric |
| Size | 6,2 (for example, 1234.56) |
| Limitations | This field cannot be blank. |
| Terminology | N/A |
| NA | |
|---|---|
| Description | Indicates whether a response of not applicable is valid for a question on a specified QA form. See Not Applicable Questions. |
| Displays In | Ad hoc reporting |
| Filter/Search By | Ad hoc reporting |
| Format | N/A |
| Size | N/A |
| Limitations | |
| Terminology | N/A |
| Completed Evaluation ID | |
|---|---|
| Description | Unique identifier assigned to a completed evaluation within inContact WFO. |
| Displays In | Ad hoc reporting |
| Filter/Search By | Ad hoc reporting |
| Format | Numeric |
| Size | System-regulated |
| Limitations | Value is determined (assigned or calculated) by system and is not user-editable. |
| Terminology | N/A |
| Evaluation Date | |
|---|---|
| Description | Date and time when a completed evaluation was first submitted. |
| Displays In | QA Evaluations list (date only), ad hoc reporting |
| Filter/Search By | Search QA Evaluations page (date only), ad hoc reporting |
| Format | Date/Time with offset |
| Size | Displays as MM/DD/YYYY HH:MM:SS AM/PM +/- HH:MM |
| Limitations | Value is determined (assigned or calculated) by system and is not user-editable. |
| Terminology | N/A |
| Possible Score (Evaluation) | |
|---|---|
| Description | Total number of possible points available for a specific QA form. |
| Displays In | Ad hoc reporting |
| Filter/Search By | Ad hoc reporting |
| Format | Numeric |
| Size | 6, 2 (for example, 1234.56) |
| Limitations | |
| Terminology | N/A |
| Actual Score (Evaluation) | |
|---|---|
| Description | Total number of points awarded on a completed QA evaluation. |
| Displays In | Ad hoc reporting |
| Filter/Search By | Ad hoc reporting |
| Format | Numeric |
| Size | 6, 2 (for example, 1234.56) |
| Limitations | |
| Terminology | N/A |
| QA % Score (Evaluation) | |
|---|---|
| Description | Displays, as a percentage, the QA score for a single completed evaluation. The score is calculated at the time a report is run (or the field is displayed) by dividing the Actual Score by the Possible Score. The value is not stored in the database. |
| Displays In | Ad hoc reporting |
| Filter/Search By | Ad hoc reporting |
| Format | N/A |
| Size | Displays as xx.xx%. |
| Limitations | Value is determined (assigned or calculated) by system and is not user-editable. |
| Terminology | N/A |
| Acknowledgment Status | |
|---|---|
| Description | Indicates whether a completed QA evaluation has been acknowledged by the agent. |
| Displays In | Ad hoc reporting |
| Filter/Search By | Ad hoc reporting |
| Format | Numeric |
| Size | 1 character (a value of 1 displays as Acknowledged; a value of 0 displays as Unacknowledged) |
| Limitations | Value is determined (assigned or calculated) by system and is not user-editable. |
| Terminology | N/A |
Notes
| Notes | |
|---|---|
| Description | Text of notes entered by any of the following during the QA review process: agent, evaluator, or arbitrator. See QA Arbitration and Review Process Overview. |
| Displays In | Ad hoc reporting |
| Filter/Search By | Ad hoc reporting |
| Format | Alphanumeric |
| Size | Varies |
| Limitations | |
| Terminology | N/A |
| QA Status | |
|---|---|
| Description | Indicates the current status of a QA evaluation. |
| Displays In | Ad hoc reporting |
| Filter/Search By | Ad hoc reporting |
| Format | Numeric (displays alphanumeric) |
| Size | Displays as Completed, In-Progress, Dispute, Question, Calibration, Calibration In Progress, Self-Evaluation, Self-Evaluation In Progress |
| Limitations | Value is determined (assigned or calculated) by system and is not user-editable. |
| Terminology | N/A |
| QA Start Date | |
|---|---|
| Description | Date and time when a QA evaluation form was started. |
| Displays In | QA Evaluations list (date only), ad hoc reporting |
| Filter/Search By | Search QA Evaluations page (date only), ad hoc reporting |
| Format | Date/Time |
| Size | Displays as MM/DD/YYYY HH:MM:SS AM/PM or MM/DD/YYYY |
| Limitations | Value is determined (assigned or calculated) by system and is not user-editable. |
| Terminology | N/A |
| QA Active/Deleted | |
|---|---|
| Description | Indicates whether a completed QA evaluation has been deleted. This is not the same as QA Status (see inContact Quality Management Fields). |
| Displays In | |
| Filter/Search By | |
| Format | Alpha, Alphanumeric, Numeric, Date/Time |
| Size | 1 character (I/O) |
| Limitations | |
| Terminology | N/A |
| Disputed Count (Evaluation) | |
|---|---|
| Description | Indicates the number of times a completed evaluation has been disputed. |
| Displays In | Ad hoc reporting |
| Filter/Search By | Ad hoc reporting |
| Format | Numeric |
| Size | Varies |
| Limitations | Value is determined (assigned or calculated) by system and is not user-editable. |
| Terminology | N/A |
| Questioned Count (Evaluation) | |
|---|---|
| Description | Indicates the number of times a completed evaluation has been questioned. |
| Displays In | Ad hoc reporting |
| Filter/Search By | Ad hoc reporting |
| Format | Numeric |
| Size | Varies |
| Limitations | Value is determined (assigned or calculated) by system and is not user-editable. |
| Terminology | N/A |
| Form Question, Completed Question | |
|---|---|
| Description | User-defined question for a specified QA form. |
| Displays In | Ad hoc reporting |
| Filter/Search By | Ad hoc reporting |
| Format | Alphanumeric |
| Size | 1024 characters |
| Limitations | |
| Terminology | N/A |
| Available Response, Question Response | |
|---|---|
| Description | User-defined response for a question on a specified QA form. In conjunction with a completed evaluation, displays the response selected by the evaluator. |
| Displays In | Ad hoc reporting |
| Filter/Search By | Ad hoc reporting |
| Format | Alphanumeric |
| Size | 50 characters |
| Limitations | This field cannot be blank. |
| Terminology | N/A |
| Question Score (Evaluation) | |
|---|---|
| Description | Number of points awarded for an individual question on a completed QA evaluation. |
| Displays In | Ad hoc reporting |
| Filter/Search By | Ad hoc reporting |
| Format | Numeric |
| Size | 6, 2 (for example, 1234.56) |
| Limitations | |
| Terminology | N/A |
| Response Score, Possible Score | |
|---|---|
| Description | User-defined score for a response to a question on a specified QA form. |
| Displays In | Ad hoc reporting |
| Filter/Search By | Ad hoc reporting |
| Format | Numeric |
| Size | 6,2 (for example, 1234.56) |
| Limitations | This field cannot be blank. |
| Terminology | N/A |
| NA | |
|---|---|
| Description | Indicates whether a response of not applicable was selected for a question on a completed evaluation. See Not Applicable Questions. |
| Displays In | Ad hoc reporting |
| Filter/Search By | Ad hoc reporting |
| Format | N/A |
| Size | N/A |
| Limitations | |
| Terminology | N/A |
| Library Item, Title | |
|---|---|
| Description | User-defined title assigned to an item in the inContact Quality Management Content Library. |
| Displays In | Content Library list, Assignment Inbox, ad hoc reporting |
| Filter/Search By | Content Library list, ad hoc reporting |
| Format | Alphanumeric |
| Size | Varies |
| Limitations | |
| Terminology | N/A |
| Acknowledged Date, Reviewed Date | |
|---|---|
| Description | Date on which an assigned user clicked Done for a specific Content Library item. See Assignment Inbox. |
| Displays In | Search Content Acknowledgments page, ad hoc reporting |
| Filter/Search By | Search Content Acknowledgments page, ad hoc reporting |
| Format | Date/time |
| Size | Varies |
| Limitations | |
| Terminology | N/A |
| Achievement ID | |
|---|---|
| Description | Unique identifier assigned to an awarded achievement. |
| Displays In | Ad hoc reporting |
| Filter/Search By | Ad hoc reporting |
| Format | Numeric |
| Size | Varies |
| Limitations | Value is determined (assigned or calculated) by system and is not user-editable. |
| Terminology | N/A |
| Achievement Points | |
|---|---|
| Description | Number of points associated with an awarded achievement. |
| Displays In | Agent Achievements Detail page, ad hoc reporting |
| Filter/Search By | Ad hoc reporting |
| Format | Numeric |
| Size | Varies |
| Limitations | |
| Terminology | N/A |
| Awarded Date | |
|---|---|
| Description | Date when an achievement was awarded to a user. |
| Displays In | Agent Achievements Detail page, ad hoc reporting |
| Filter/Search By | Awarded Achievements page, ad hoc reporting |
| Format | Date |
| Size | Displays as MM/DD/YYYY |
| Limitations | Value is determined (assigned or calculated) by system and is not user-editable. |
| Terminology | N/A |
| Expiration Date | |
|---|---|
| Description | Date when the points associated with an awarded achievement expire. |
| Displays In | Agent Achievements Detail page, ad hoc reporting |
| Filter/Search By | Ad hoc reporting |
| Format | Date |
| Size | Displays as MM/DD/YYYY |
| Limitations | |
| Terminology | N/A |
| Achievement Status | |
|---|---|
| Description | Indicates whether an awarded achievements has expired. |
| Displays In | Ad hoc reporting |
| Filter/Search By | Awarded Achievements page, ad hoc reporting |
| Format | N/A |
| Size | N/A |
| Limitations | Value is determined (assigned or calculated) by system and is not user-editable. |
| Terminology | N/A |
| Achievement Name | |
|---|---|
| Description | User-defined name for an achievement type. |
| Displays In | Achievement Types page, Agent Achievements Detail page, Award an Achievement page, ad hoc reporting |
| Filter/Search By | Ad hoc reporting |
| Format | Alphanumeric |
| Size | 50 characters |
| Limitations | This field cannot be blank. |
| Terminology | N/A |